
- EUR/USD reverses three consecutive daily gains on Monday.
- There is initial resistance at the 7-month line near 1.0160.
The EUR/USD It suffers some selling pressure and deflates below the parity zone at the beginning of the week.
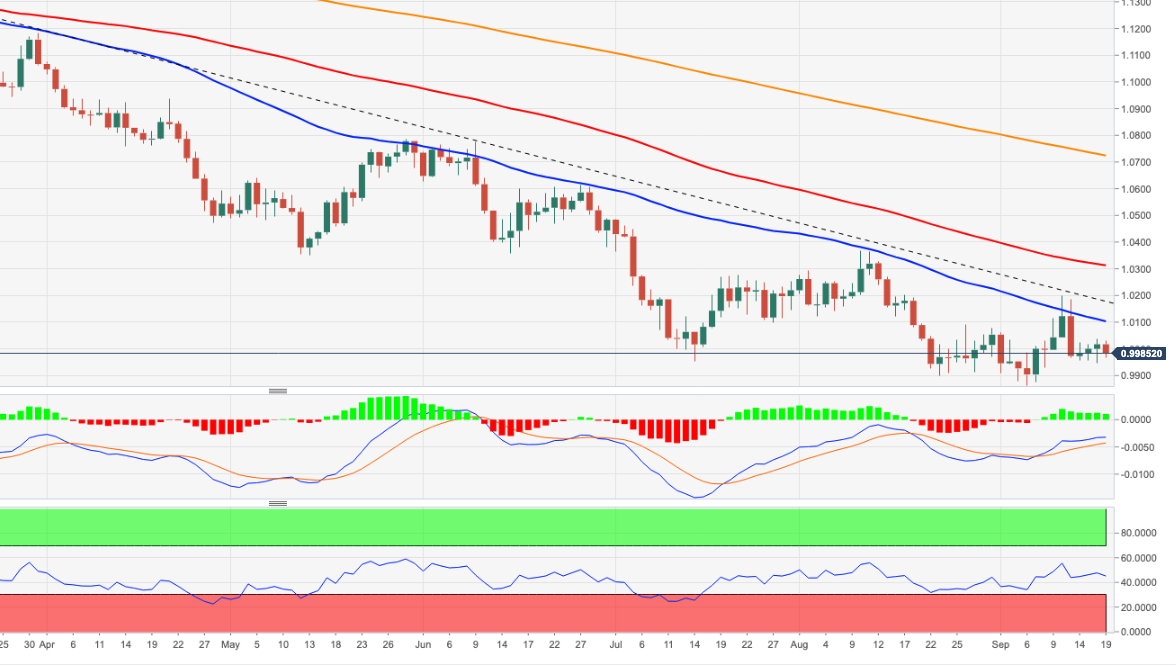
The pair appears to have embarked on a consolidation range ahead of Wednesday’s key FOMC event. Immediately to the upside is the interim 55-day SMA at 1.0101 before the key 7-month resistance line near 1.0160 today. A move beyond the latter is needed to mitigate downside pressure and allow spot to face September high at 1.0197 (Sep 12) before further gains possible.
In the long term, the bearish view on the pair is expected to prevail as long as it trades below the 200-day SMA at 1.0722.
EUR/USD daily chart
Technical levels
Source: Fx Street
With 6 years of experience, I bring to the table captivating and informative writing in the world news category. My expertise covers a range of industries, including tourism, technology, forex and stocks. From brief social media posts to in-depth articles, I am dedicated to creating compelling content for various platforms.


