
- EUR/USD adds to Friday’s gains beyond 1.0400.
- The bulls could push the pair to the 1.0640 area.
The rebound of EUR/USD gathers more traction above 1.0400 on Monday.
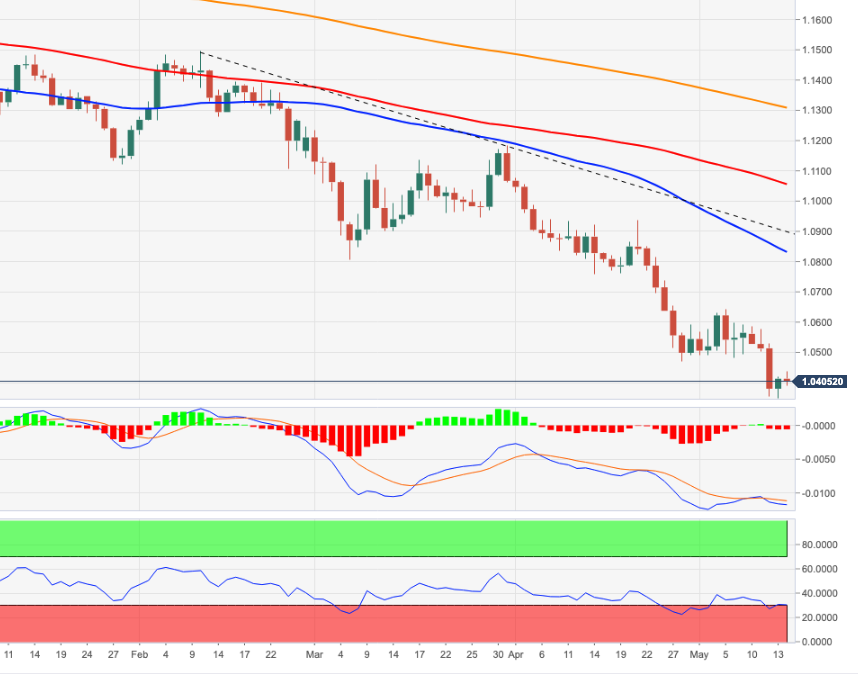
Considering the pair’s ongoing price action and oversold condition (as per daily RSI), there appears to be additional room for a continuation of the bounce at least in the short term. Against that, the next hurdle emerges at the weekly high at 1.0641 (May 5). In light of the underlying bearish view of the pair, further rally should be viewed as a selling opportunity.
Below the 3-month line around 1.0900, the pair is expected to remain under pressure and vulnerable to further losses.
EUR/USD daily chart
Technical levels
Source: Fx Street
With 6 years of experience, I bring to the table captivating and informative writing in the world news category. My expertise covers a range of industries, including tourism, technology, forex and stocks. From brief social media posts to in-depth articles, I am dedicated to creating compelling content for various platforms.


