
- EUR/USD struggles to stay above 1.0840 amid investors' risk aversion.
- The surprise rate cut by the SNB has raised expectations of a rate cut by the ECB.
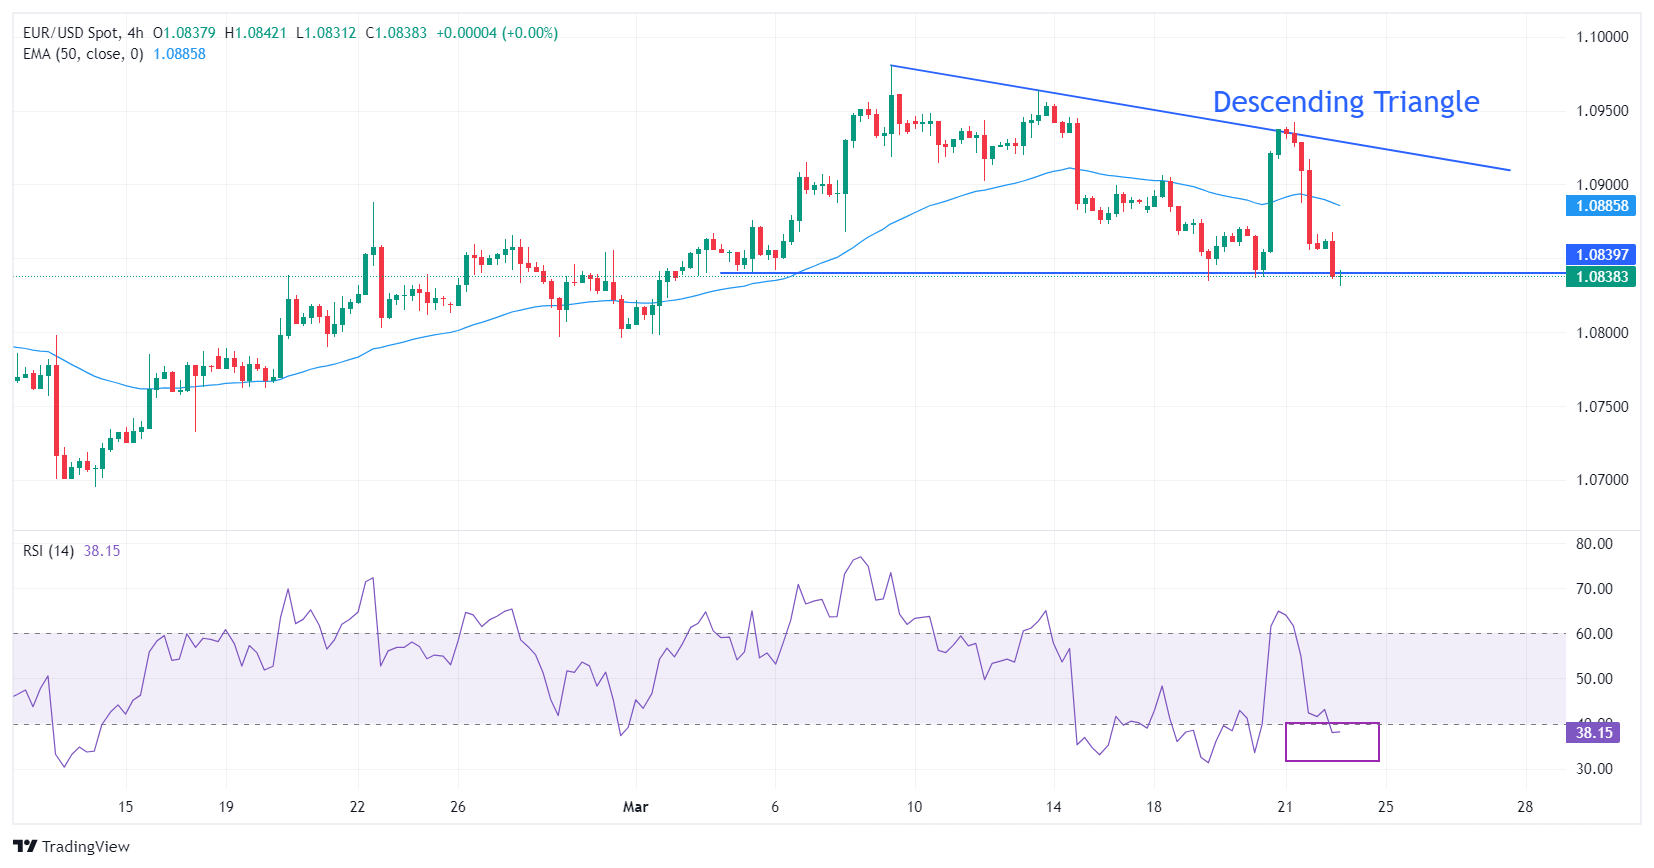
- The pair is close to breaking out a descending triangle.
The EUR/USD pair extends its bearish trend to three-day lows around 1.0830 at the start of the European session on Friday. The pair is expected to witness the improving appeal of safe-haven assets after the Swiss National Bank (SNB) surprise cut interest rates by 25 basis points (bps) to 1.50% on Thursday.
The SNB's surprise rate cut has raised hopes that inflation is coming under control and that other central banks will follow suit. This has accentuated demand for the US Dollar, as the Federal Reserve (Fed) has revised upward the annual underlying Personal Consumption Expenditure (PCE) Price Index forecast to 2.6% by 2024 from previous estimates of 2.4% in its latest economic projections. The DXY Dollar Index hits a new two-week high around 104.20 and recovers its post-Fed decision losses.
Meanwhile, the Euro is pressured by market expectations that the European Central Bank (ECB) will lower interest rates at its June meeting, driven by the SNB's surprise rate cut. The pace of slowing inflation in the Eurozone is faster than that of the US economy, reinforcing hopes that the ECB will reduce rates more aggressively than the Federal Reserve (Fed).
The EUR/USD pair is about to break out of the descending triangle pattern formed on the 4-hour time frame. The pair is near the horizontal support of the mentioned chart pattern, drawn from the March 5 low at 1.0840, while resistance lies from the March 8 high at 1.0981.
Short-term demand is bearish as it is trading below the 50-period EMA, which is located around 1.0886.
The 14-period Relative Strength Index (RSI) is moving within the bearish range of 20-40, indicating bearish momentum.
EUR/USD 4-hour chart
Source: Fx Street
I am Joshua Winder, a senior-level journalist and editor at World Stock Market. I specialize in covering news related to the stock market and economic trends. With more than 8 years of experience in this field, I have become an expert in financial reporting.


