
- EUR/USD breaks two consecutive weeks of gains and falls 0.42%.
- The common currency is trendless, within the range of 1.0096-1.0278.
- From a daily chart point of view, EUR/USD could test the low of 1.0096 before retesting recent years’ lows below parity.
The EUR/USD slumps late at the close on Wall Street, down 0.62%, hit by an upbeat US jobs report that bolstered the USD, while raising the odds of a new “jumbo” rate hike by the US. the Fed at the September meeting. For its part, the EUR/USD is trading at 1.0180 at the time of writing this article.
EUR/USD Price Analysis: Technical Outlook
The daily chart of the shared currency shows the pair consolidating in the 1.0096-1.0278 zone. Although the US Non-Farm Payrolls report has supported the dollar, EUR/USD has held firm and rebounded from the daily low of 1.0141, retracing the 20-day EMA. However, the major currency is under selling pressure as the RSI changed gears, heading lower, and crossed below its 7-day SMA, opening the door for further declines.
Therefore, the first support for the EUR/USD would be the 20-day EMA at 1.0158. Breaking below will expose the bottom of the aforementioned trading range at 1.0096, which, once breached, paves the way for a refresh of recent years’ lows below parity.
On the other hand, the first resistance of the EUR/USD is 1.0200. If it exceeds it, the euro will go to the 2 daily highs of August, at 1.0293, before looking for the figure of 1.0300.
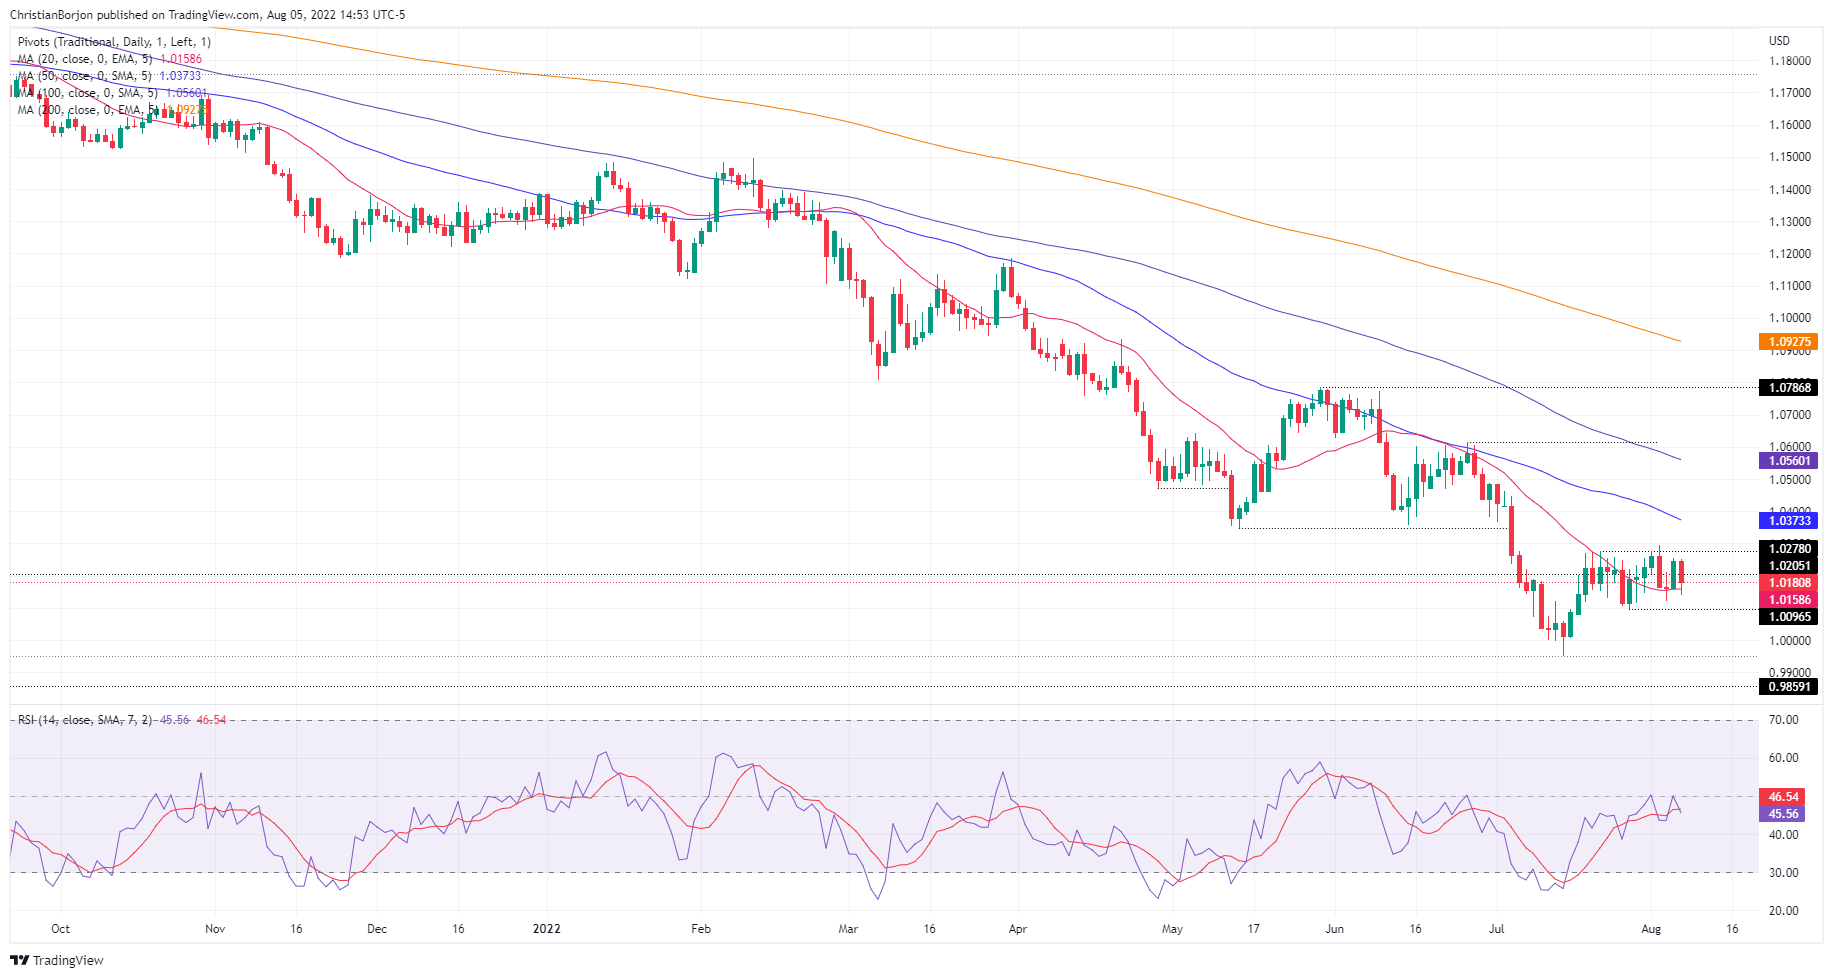
EUR/USD daily chart
EUR/USD Key Technical Levels
Source: Fx Street
With 6 years of experience, I bring to the table captivating and informative writing in the world news category. My expertise covers a range of industries, including tourism, technology, forex and stocks. From brief social media posts to in-depth articles, I am dedicated to creating compelling content for various platforms.


