
- EUR/USD keeps erratic activity in place this week.
- The 1.0670/80 band continues to cap the upside so far.
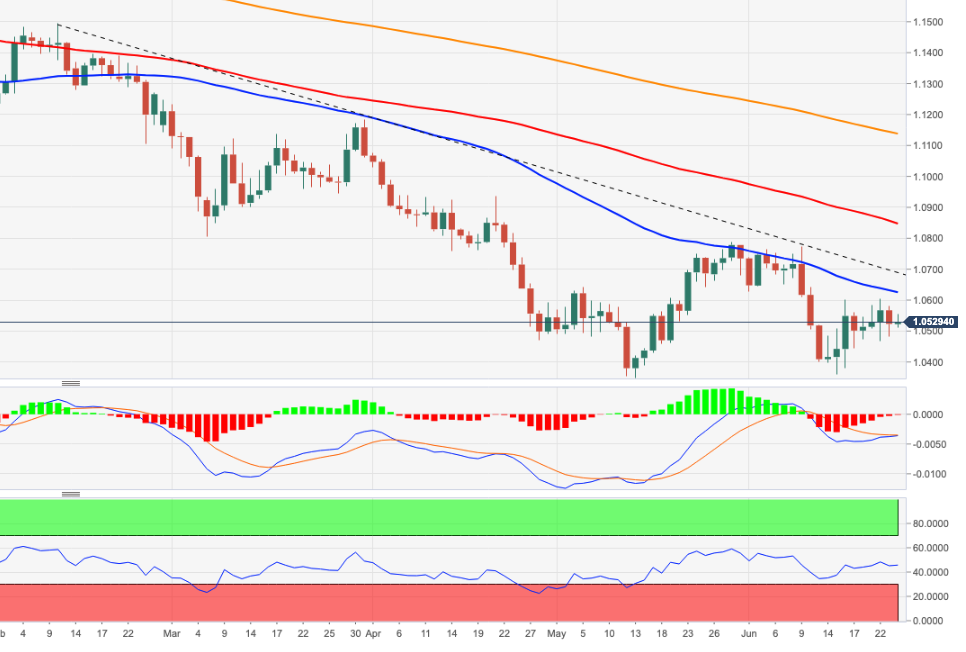
EUR/USD resumes bullish bias beyond 1.0500 after Thursday’s moderate pullback.
So far, and as long as the 4-month line at the 1.0670/80 band limits the uptrend, further pullbacks in the pair should remain on the cards in the near term. However, breaking out of this area could spark a run to June’s high of 1.0773 and May’s high of 1.0786.
In the longer term, the bearish view on the pair is expected to prevail as long as it trades below the 200 SMA at 1.1136.
EUR/USD day chart
Source: Fx Street
With 6 years of experience, I bring to the table captivating and informative writing in the world news category. My expertise covers a range of industries, including tourism, technology, forex and stocks. From brief social media posts to in-depth articles, I am dedicated to creating compelling content for various platforms.


