
- EUR/USD corrects lower and falls to 1.0270.
- It is expected to continue rising from above 1.0370/80.
EUR/USD is under pressure and breaks below 1.0300 after four consecutive daily gains on Friday.
Despite the breakout, a continuation of the uptrend seems favored in the very short term. That said, the pair needs to break above the August high at 1.0368 (Aug 10) as well as the 6-month resistance line around 1.0380 to open the door for a likely move towards the 100 SMA today. 1.0522.
In the longer term, the bearish view on the pair is expected to prevail as long as it trades below the 200-day simple moving average at 1.0894.
EUR/USD day chart
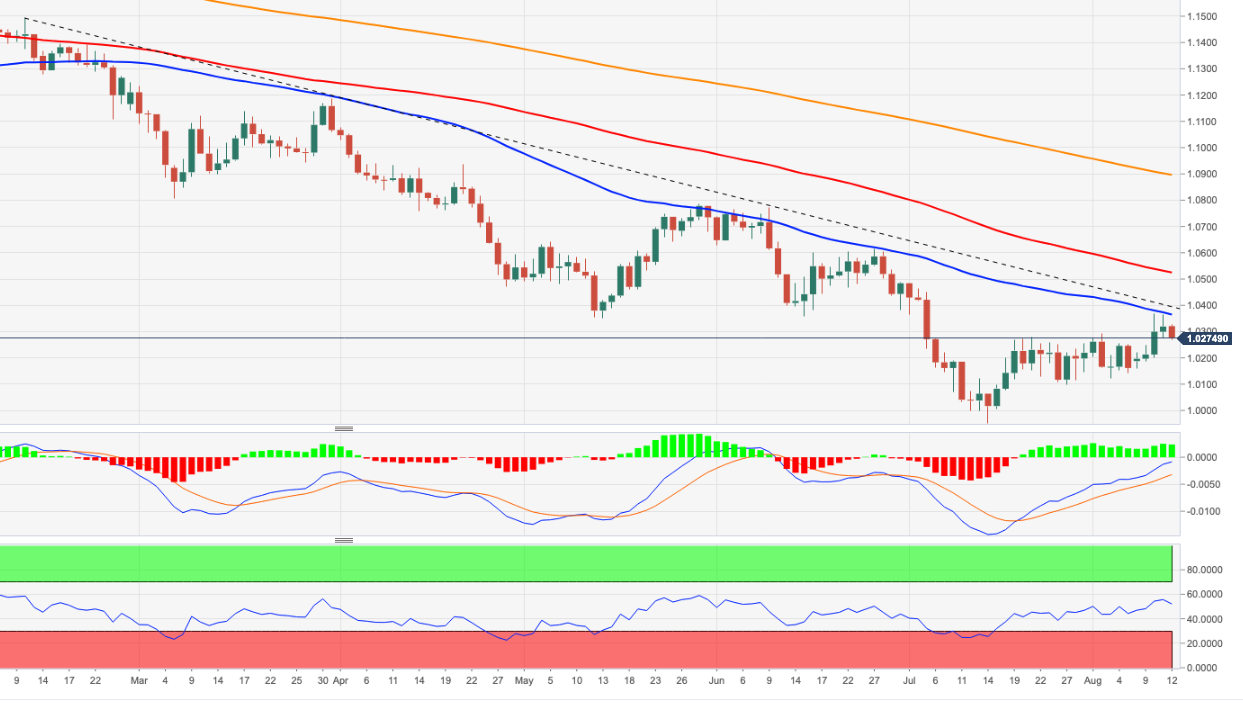
Source: Fx Street
With 6 years of experience, I bring to the table captivating and informative writing in the world news category. My expertise covers a range of industries, including tourism, technology, forex and stocks. From brief social media posts to in-depth articles, I am dedicated to creating compelling content for various platforms.


