
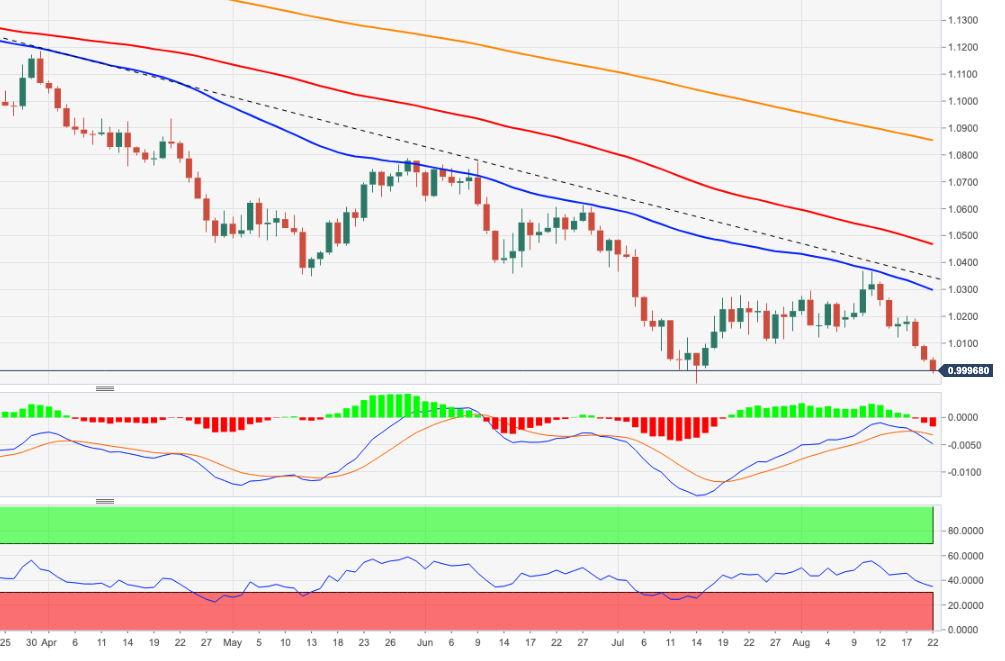
- EUR/USD extends the fall below the parity zone.
- A deeper pullback could see the 2022 lows at 0.9950 retested.
The EUR/USD It breaks below the parity zone and marks new 6-week lows at the start of the week.
At the moment, it seems that there will be more losses. Conversely, the pair could face the 2022 low at 0.9952 (July 14) on a convincing breakout of the parity region.
In the long term, the bearish view on the pair is expected to prevail as long as it trades below the 200-day SMA at 1.0852.
EUR/USD daily chart
Technical levels
Source: Fx Street
With 6 years of experience, I bring to the table captivating and informative writing in the world news category. My expertise covers a range of industries, including tourism, technology, forex and stocks. From brief social media posts to in-depth articles, I am dedicated to creating compelling content for various platforms.


