
- EUR/USD rises and hits fresh May highs at 1.0780.
- The next move up is the 3-month resistance line near 1.0800.
The EUR/USD maintains the uptrend and marks new monthly highs around 1.0780 on Monday.
Considering the current behavior of the pair, a continuation of the bounce seems likely at least in the short term. That said, the next upside barrier now appears at the 3-month resistance line near 1.0800.
Breaking above this area should mitigate selling pressure and allow a likely move towards the weekly high at 1.0936 (21st Apr).
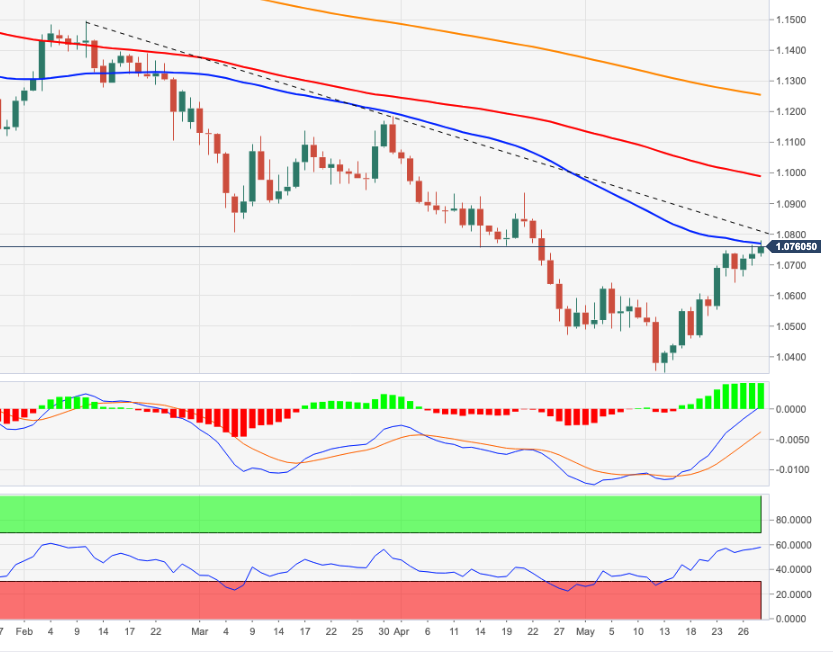
EUR/USD daily chart
Technical levels
Source: Fx Street
With 6 years of experience, I bring to the table captivating and informative writing in the world news category. My expertise covers a range of industries, including tourism, technology, forex and stocks. From brief social media posts to in-depth articles, I am dedicated to creating compelling content for various platforms.


