
- EUR/USD reverses initial pullback and recovers 1.0700 and above.
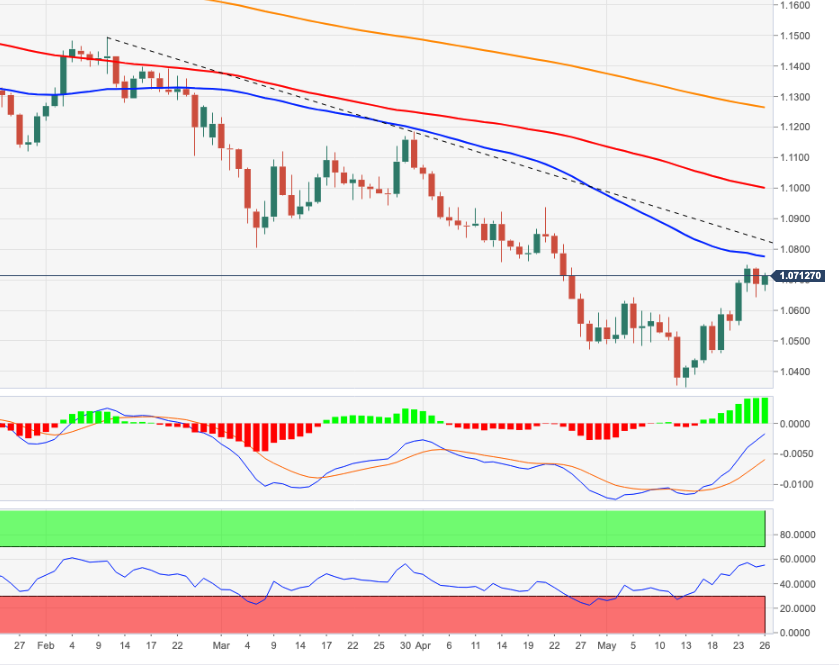
- The next target on the upside emerges at the 55-day SMA at 1.0774.
The EUR/USD recovers some of the ground lost on Wednesday and manages to recover the area above 1.0700 on Thursday.
Considering the current price action of the pair, a continuation of the bounce looks likely at least in the short term. That said, the next upside barrier now appears at the 55-day SMA today at 1.0774 before the 3-month resistance line near 1.0820.
Breaking above this area should mitigate selling pressure and allow a likely move towards the weekly high at 1.0936 (21st Apr).
The daily RSI around 55 also indicates that the pair could continue to rise until reaching the overbought zone (70).
EUR/USD daily chart
Technical levels
Source: Fx Street
With 6 years of experience, I bring to the table captivating and informative writing in the world news category. My expertise covers a range of industries, including tourism, technology, forex and stocks. From brief social media posts to in-depth articles, I am dedicated to creating compelling content for various platforms.


