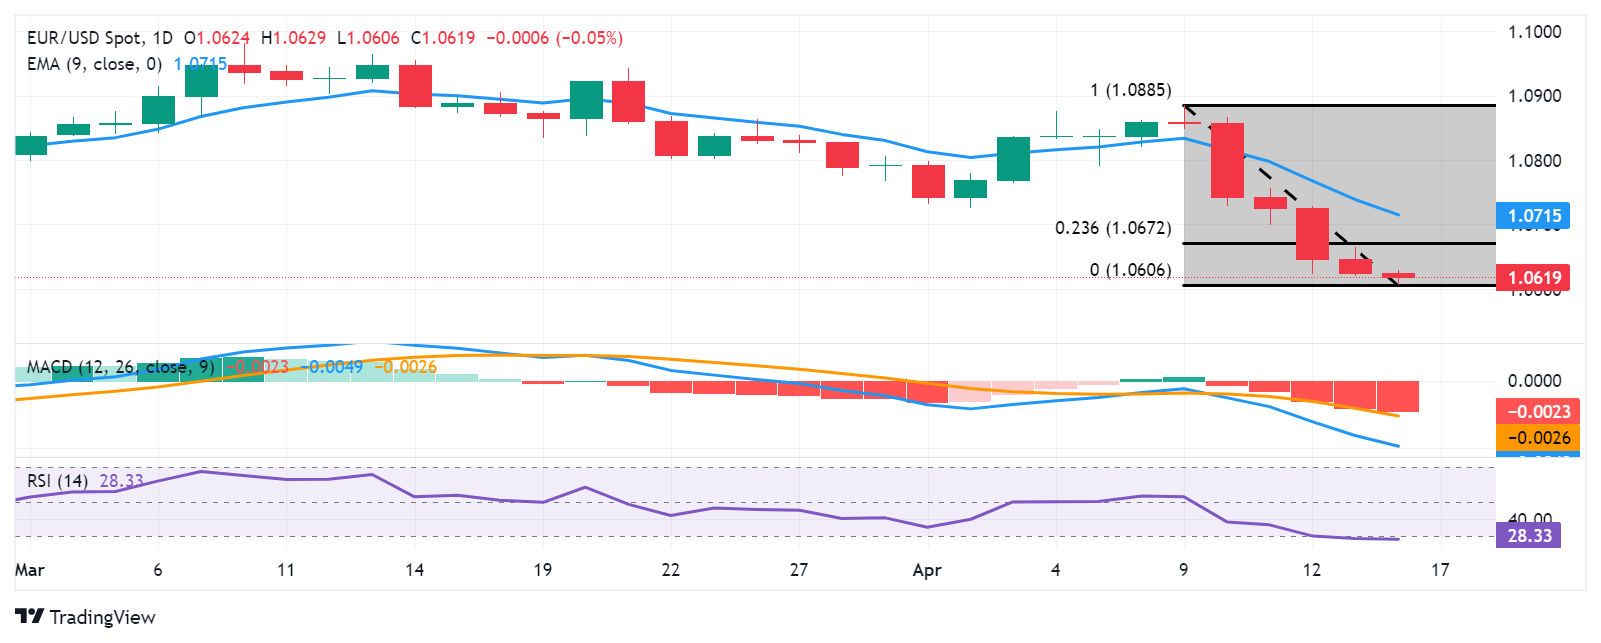
- EUR/USD could test the support at the psychological level of 1.0600.
- The pair could extend its losses to the November low at 1.0516 as technical analysis suggests bearish confirmation.
- The area around the main level of 1.0650 and the 23.6% Fibo level at 1.0672 appears as the resistance zone.
EUR/USD continues its losing streak for the sixth consecutive session on Tuesday, hovering around 1.0620 during Asian trading hours. The strength of the US Dollar put pressure on the EUR/USD pair, possibly driven by rising US Treasury yields. Additionally, stronger-than-expected US retail sales data has raised expectations that the Federal Reserve (Fed) could extend its stance on raising interest rates.
From the technical point of view, the analysis suggests a bearish sentiment for the pair as the 14-day Relative Strength Index (RSI) sits below the 50-point mark. Furthermore, the lagging indicator, the Moving Average Convergence Divergence (MACD), is located below the center line and shows a divergence below the signal line, indicating weakness for the pair.
EUR/USD could find immediate support around the psychological level of 1.0600. A break below this level could put bearish pressure on the pair to navigate the region around the main level of 1.0550, followed by the November low at 1.0516.
To the upside, the main level of 1.0650 appears as the key barrier, followed by the 23.6% Fibonacci level at 1.0672. If it breaks this last level, the pair could explore the area of the psychological level of 1.0700 and the nine-day EMA at 1.0715.
EUR/USD: Daily Chart

EUR/USD
| Panorama | |
|---|---|
| Today's Latest Price | 1.0618 |
| Today's Daily Change | -0.0006 |
| Today's Daily Change % | -0.06 |
| Today's Daily Opening | 1.0624 |
| Trends | |
|---|---|
| 20 Daily SMA | 1.0801 |
| SMA of 50 Daily | 1.0821 |
| SMA of 100 Daily | 1.0864 |
| SMA of 200 Daily | 1.0828 |
| Levels | |
|---|---|
| Previous Daily High | 1.0665 |
| Previous Daily Low | 1,062 |
| Previous Weekly High | 1.0885 |
| Previous Weekly Low | 1.0622 |
| Previous Monthly High | 1.0981 |
| Previous Monthly Low | 1.0768 |
| Daily Fibonacci 38.2% | 1.0637 |
| Daily Fibonacci 61.8% | 1.0648 |
| Daily Pivot Point S1 | 1.0608 |
| Daily Pivot Point S2 | 1.0592 |
| Daily Pivot Point S3 | 1.0563 |
| Daily Pivot Point R1 | 1.0653 |
| Daily Pivot Point R2 | 1.0682 |
| Daily Pivot Point R3 | 1.0698 |
Source: Fx Street
I am Joshua Winder, a senior-level journalist and editor at World Stock Market. I specialize in covering news related to the stock market and economic trends. With more than 8 years of experience in this field, I have become an expert in financial reporting.


