- EUR/USD attracts some buyers and moves away from the two-week low reached on Tuesday.
- The technical setup warrants some caution for bulls ahead of the Fed's decision.
- A sustained break below the 1.0835 confluence would pave the way for deeper losses.
The EUR/USD pair moves slightly higher at the start of the European session on Wednesday and, for the moment, appears to have broken a two-day losing streak to a near two-week low, around the 1.0835 region touched the previous day. However, the pair lacks follow-through buying as traders seem reluctant to open aggressive positions and prefer to wait on the sidelines awaiting the results of the two-day FOMC monetary policy meeting.
The Federal Reserve (Fed) is expected to keep rates unchanged, although it could lower its forecast for rate cuts in 2024 from three to two, due to persistent inflation. Therefore, attention will remain focused on the so-called “dot plot”, which, together with statements from Fed Chairman Jerome Powell, will be analyzed for clues about the future path of rate cuts. This, in turn, will play a key role in influencing the price dynamics of the US Dollar (USD) and provide fresh directional momentum to the EUR/USD pair.
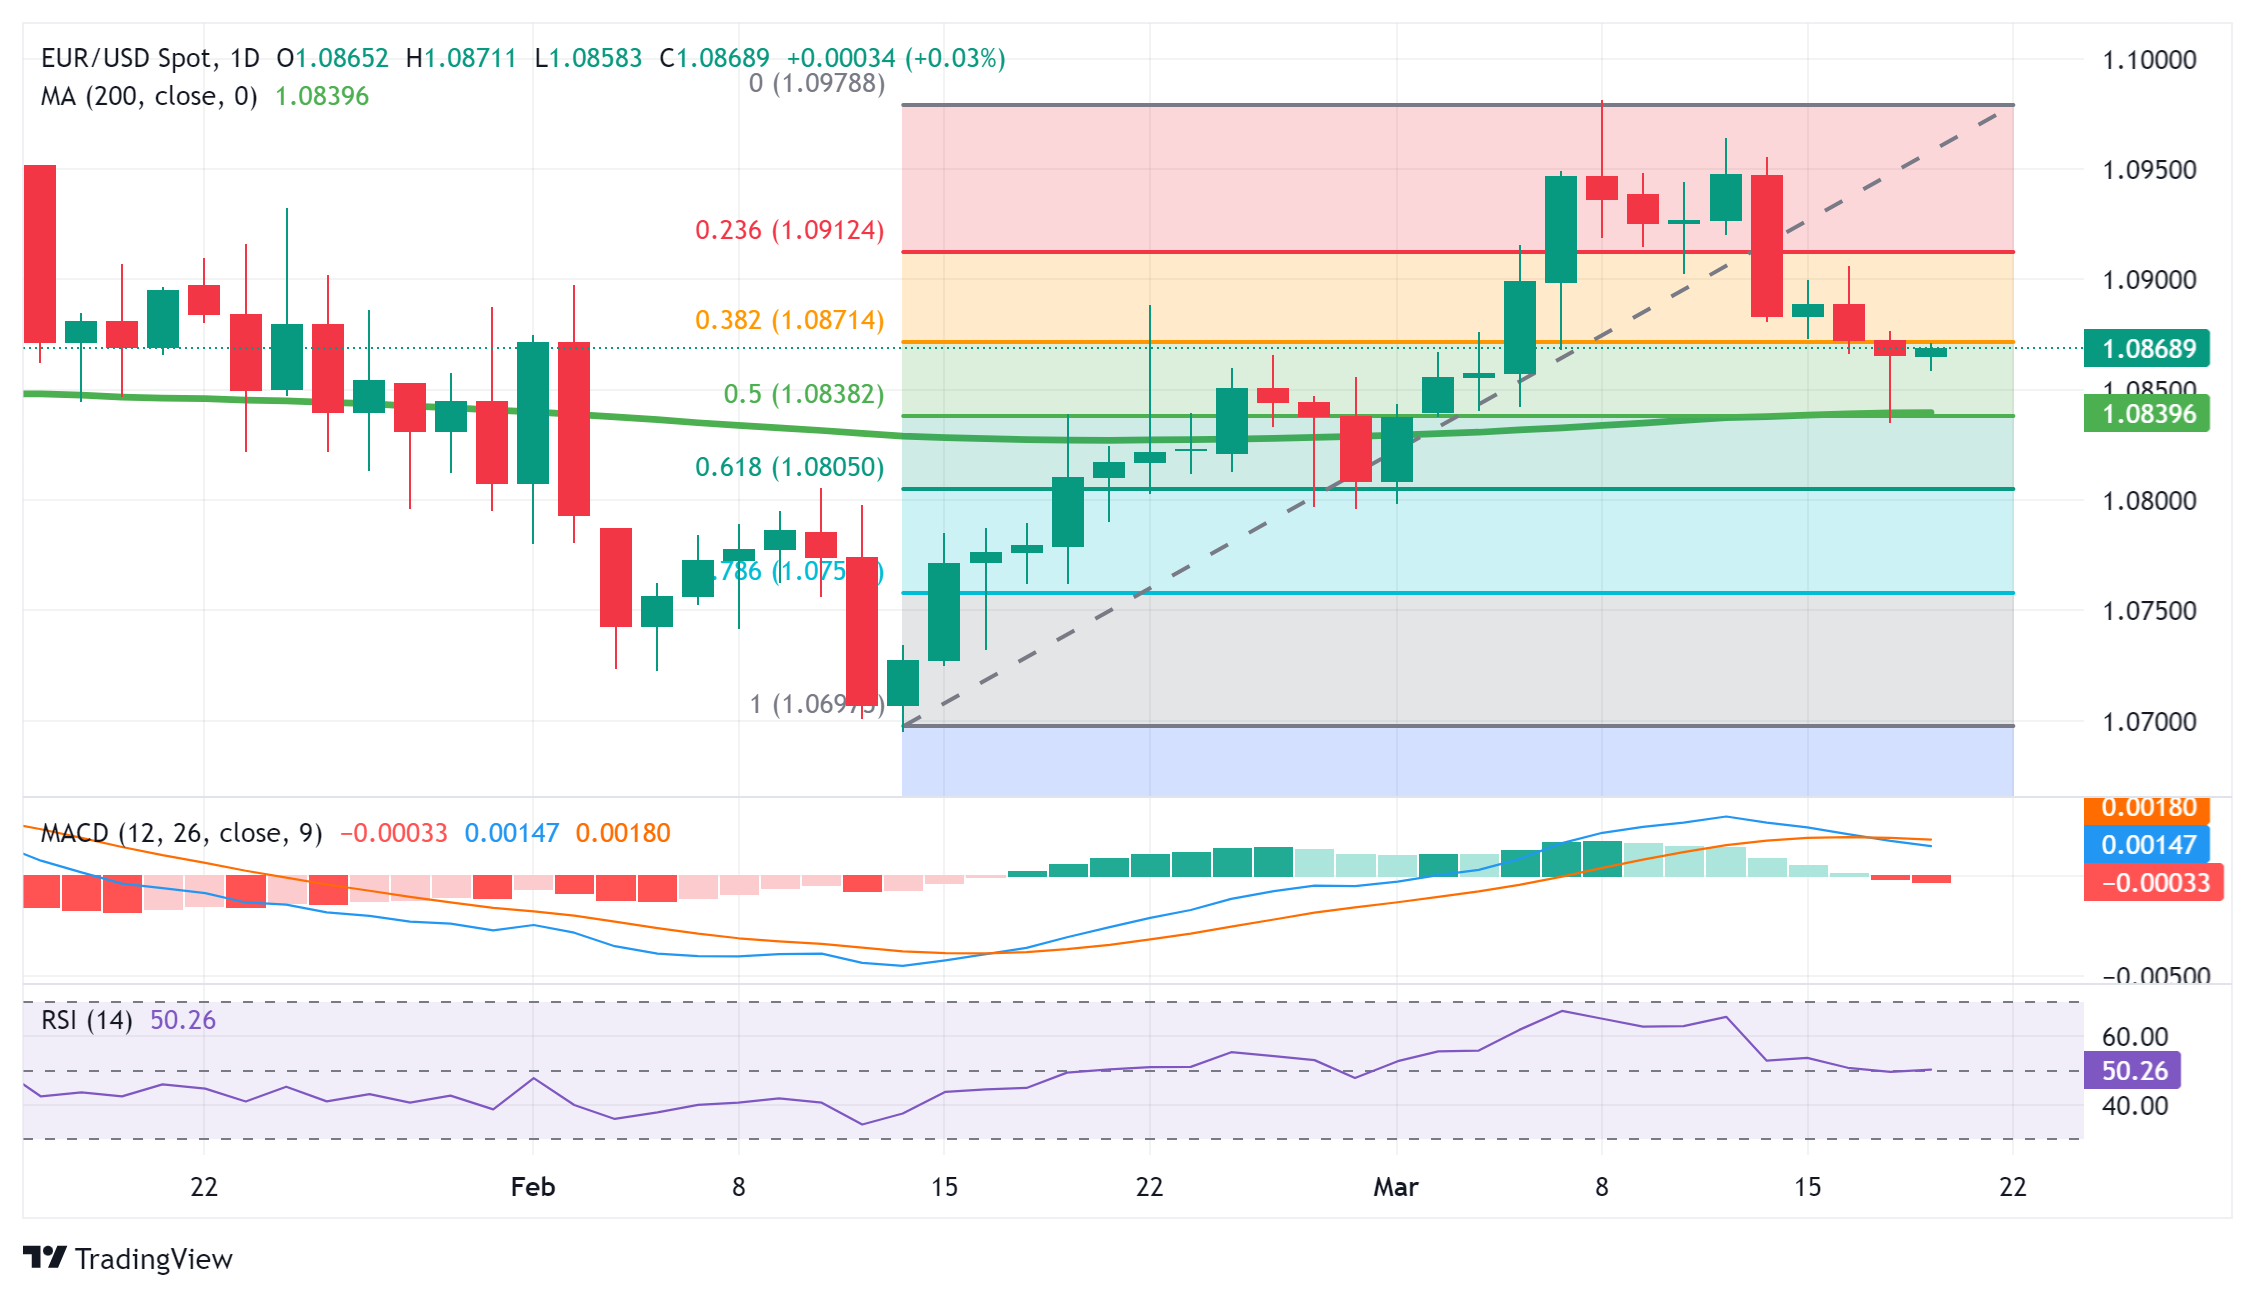
From a technical perspective, the recent pullback from the 1.0980 region, the highest level since January 12 touched earlier this month, stalled near the 1.0835 confluence support. This zone comprises the all-important 200-day SMA and the 50% Fibonacci retracement of the positive February-March move, which could continue to protect the immediate decline and act as a key point. A convincing break below that level will be considered a new trigger for the bears and will drag the EUR/USD pair lower.
Since the oscillators on the daily chart have just started to gain negative traction, the pair could then accelerate the decline towards the round 1.0800 level, or 61.8% Fibonacci, en route to the 1.0760-1.0755 region. If EUR/USD continued to sell off, it could retest levels below 1.0700, or the yearly low reached on February 14.
On the other hand, any subsequent upside move will face strong resistance near the 1.0900 zone, close to the breakout point of the 23.6% Fibonacci support. Sustained strength above that level will suggest that the corrective pullback is over and will lift the EUR/USD pair back to the monthly high, around the 1.0980 region. The momentum could extend beyond the psychological level of 1.1000, towards the next relevant hurdle near the 1.1040 area.
EUR/USD daily chart
EUR/USD additional technical levels
| Panorama | |
|---|---|
| Today's Latest Price | 1.0868 |
| Today's Daily Change | 0.0003 |
| Today's Daily Change % | 0.03 |
| Today's Daily Opening | 1.0865 |
| Trends | |
|---|---|
| 20 Daily SMA | 1.0872 |
| SMA of 50 Daily | 1.0849 |
| SMA of 100 Daily | 1.0864 |
| SMA of 200 Daily | 1.0839 |
| Levels | |
|---|---|
| Previous Daily High | 1.0877 |
| Previous Daily Low | 1.0835 |
| Previous Weekly High | 1.0964 |
| Previous Weekly Low | 1.0873 |
| Previous Monthly High | 1.0898 |
| Previous Monthly Low | 1.0695 |
| Daily Fibonacci 38.2% | 1.0851 |
| Daily Fibonacci 61.8% | 1.0861 |
| Daily Pivot Point S1 | 1.0841 |
| Daily Pivot Point S2 | 1.0817 |
| Daily Pivot Point S3 | 1.0799 |
| Daily Pivot Point R1 | 1.0883 |
| Daily Pivot Point R2 | 1.0901 |
| Daily Pivot Point R3 | 1.0925 |
Source: Fx Street
I am Joshua Winder, a senior-level journalist and editor at World Stock Market. I specialize in covering news related to the stock market and economic trends. With more than 8 years of experience in this field, I have become an expert in financial reporting.


