
- EUR/USD leaves the monthly high zone near 1.0700.
- The 1.0700 area seems reinforced by the 55-day SMA.
The pair EUR/USD began a significant corrective decline after reaching monthly highs just below the 1.0700 barrier early on Tuesday.
Should the bulls regain control, the pair is expected to challenge the October high at 1.0694 (Oct 12), which is supported by the transient 55-day SMA at 1.0702 and sits ahead of the weekly high at 1.0736 (September 20).
Meanwhile, losses remain on the table as long as the pair navigates below the 200 SMA at 1.0816.
EUR/USD Daily Chart
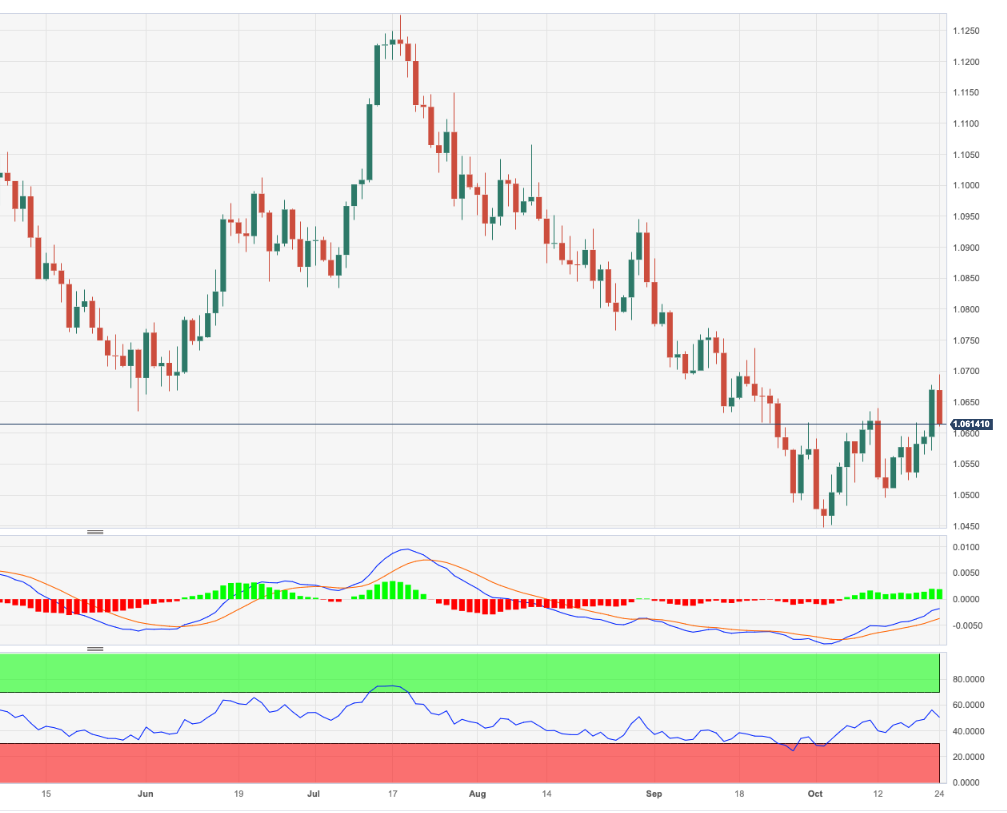
Source: Fx Street
I am Joshua Winder, a senior-level journalist and editor at World Stock Market. I specialize in covering news related to the stock market and economic trends. With more than 8 years of experience in this field, I have become an expert in financial reporting.


