
- EUR/USD is trading on a firm note and is approaching the 1.0400 area.
- Further gains should break the 9-month resistance line near 1.0420.
The bullish attempt on Wednesday motivates the EUR/USD trade a considerable distance from the key 1.0400 zone.
The pair should break the 9-month resistance line around 1.0420 sustainably to get some air and therefore challenge the November high at 1.0496 (28 Nov) just before the round level at 1.0500.
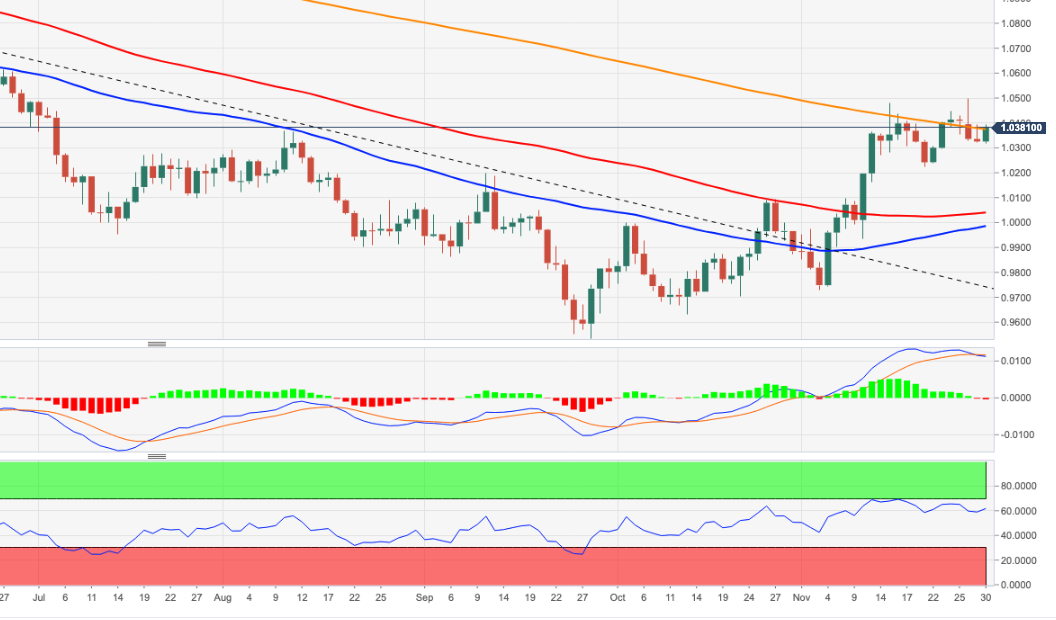
Above the 200-day SMA (1.0372), the outlook for the pair should remain constructive.
EUR/USD daily chart
Source: Fx Street
I am Joshua Winder, a senior-level journalist and editor at World Stock Market. I specialize in covering news related to the stock market and economic trends. With more than 8 years of experience in this field, I have become an expert in financial reporting.


