
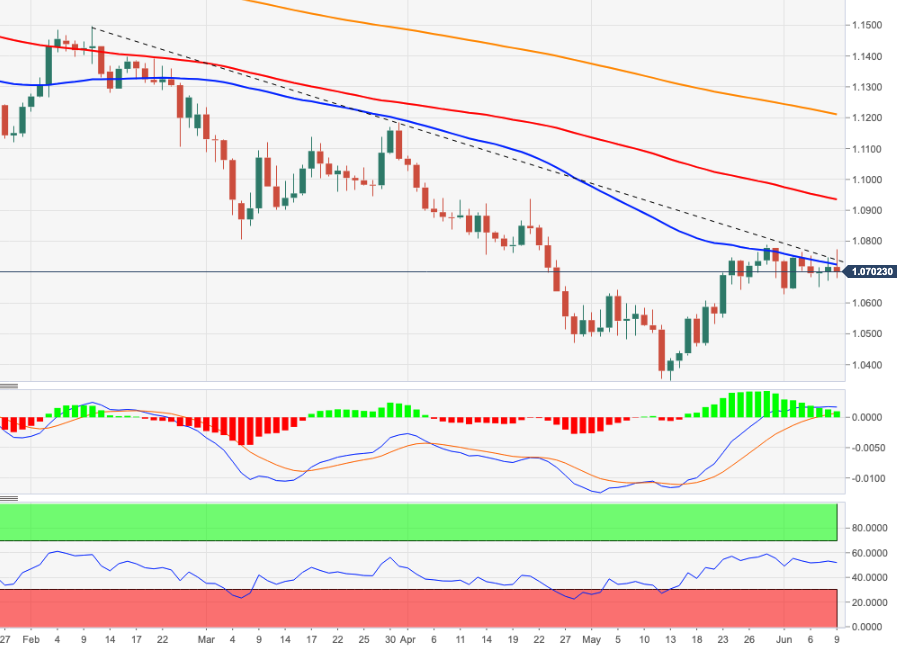
- EUR/USD could not sustain the rally beyond 1.0770.
- The next target on the downside is the June low around 1.0630.
The upward attempt EUR/USD induced by the ECB moderated on Thursday in the area of 1.0770.
The pair’s inability to break above the 4-month resistance line near 1.0740 carries the potential to trigger a corrective leg lower sooner rather than later. That said, there is initial support at the June low at 1.0627 (June 1).
In the long term, the bearish view on the pair is expected to prevail as long as it trades below the 200-day SMA at 1.1209.
EUR/USD daily chart
Technical levels
Source: Fx Street
With 6 years of experience, I bring to the table captivating and informative writing in the world news category. My expertise covers a range of industries, including tourism, technology, forex and stocks. From brief social media posts to in-depth articles, I am dedicated to creating compelling content for various platforms.


