
- EUR/USD consolidates within a tight range at the start of the European session on Thursday.
- The fundamental background and technical setup support the prospects for further losses.
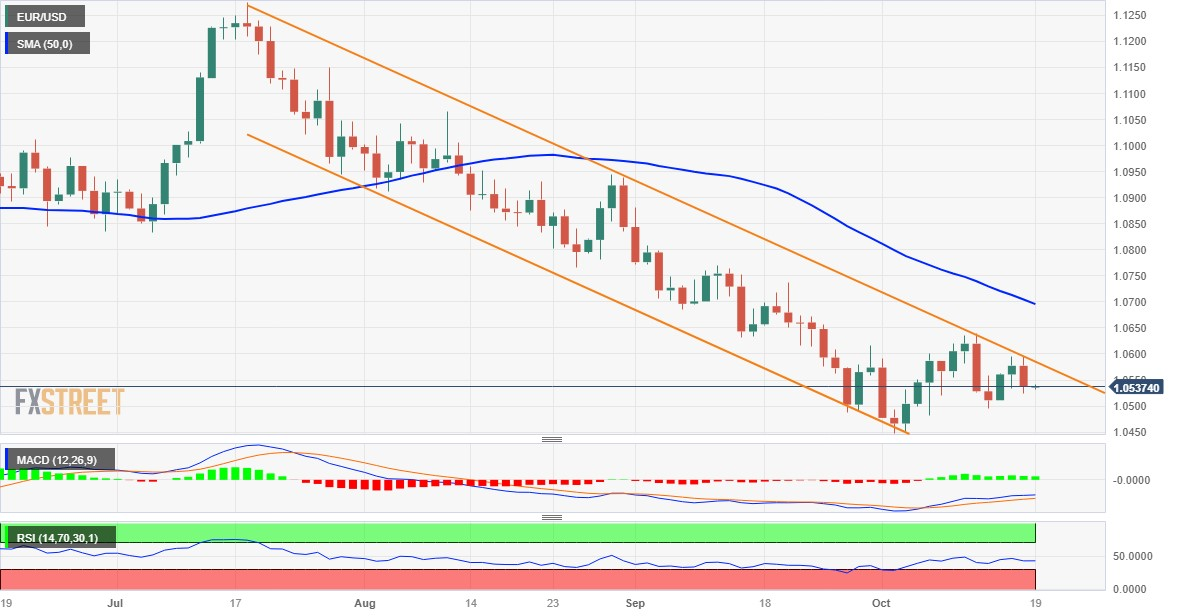
- A convincing breakout of the descending channel would nullify the downtrend.
The EUR/USD pair fails to advance strongly on Thursday and oscillates within a tight range below the 1.0550 area at the start of the European session. The fundamental background, meanwhile, appears to be leaning in favor of the bears and suggests that the path of least resistance for the pair is to the downside.
Growing acceptance that the Federal Reserve (Fed) will keep rates elevated for longer, in light of the US economy’s recovery and to bring inflation back to its 2% target, pushes up Treasury yields to 10 years to a new maximum of 16 years. This, along with the risk of an escalation of war between Hamas and Israel, continues to support the safe-haven US Dollar (USD). Aside from this, speculation that further rate hikes by the European Central Bank (ECB) could be off the table validate the negative outlook for the EUR/USD pair.
Even from a technical standpoint, recent failures near the upper boundary of a descending channel extending from a 17-month high touched in June point to a well-established short-term bearish trend. Furthermore, the oscillators on the daily chart, although they have recovered from lower levels, continue to remain in negative territory. This, in turn, supports the prospects of an extension of this week’s decline from the vicinity of the 1.0600 level and a new depreciating move for the EUR/USD pair.
Therefore, a pullback towards the weekly low, around the psychological level of 1.0500, seems a clear possibility. The bears would see the selling as a new trigger that would drag the EUR/USD pair back to the yearly low, around the 1.0450-1.0445 area it touched earlier this month.
On the opposite side, the 1.0600 level, which now coincides with the resistance of the downtrend channel, should continue to act as a strong immediate barrier. A convincing breakout would allow the EUR/USD pair to surpass the monthly high, around the 1.0635 area, and recover the 1.0700 level, which converges with the 50-day SMA. This last level should act as a key point, which if broken decisively will suggest that the pair has formed a short-term bottom and pave the way for additional gains.
EUR/USD Daily Chart
EUR/USD additional technical levels
Source: Fx Street
I am Joshua Winder, a senior-level journalist and editor at World Stock Market. I specialize in covering news related to the stock market and economic trends. With more than 8 years of experience in this field, I have become an expert in financial reporting.


