
- EUR/USD is under pressure and defies parity.
- Immediately to the downside comes the weekly low at 0.9944.
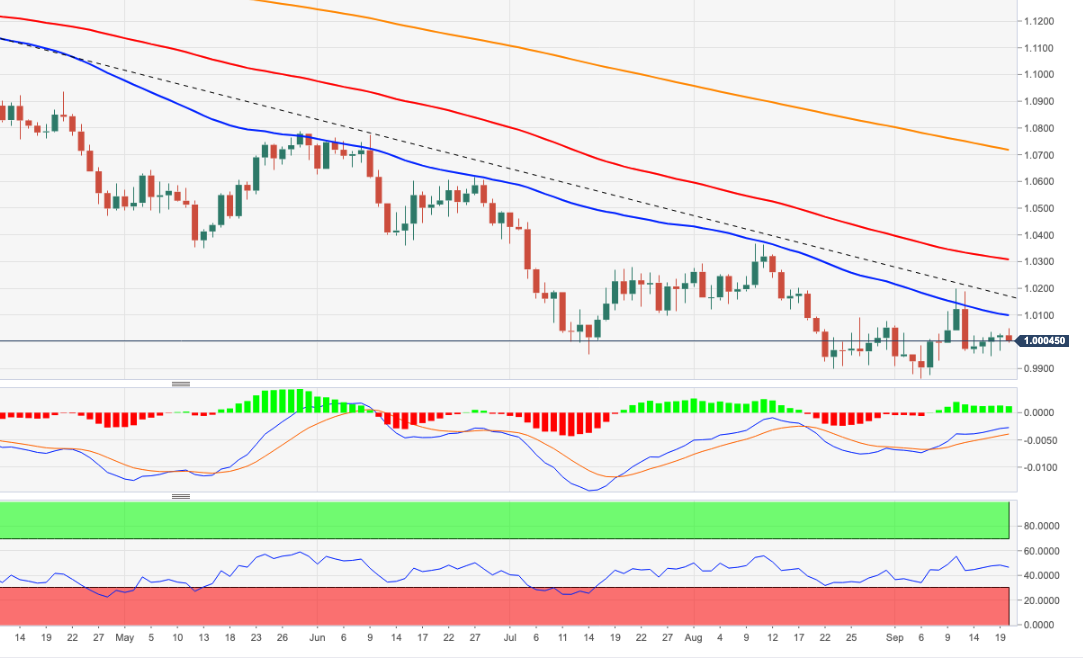
EUR/USD triggers a downward correction shortly after hitting multi-session highs around 1.0050 on Tuesday.
The pair appears to have embarked on a consolidation range ahead of Wednesday’s key FOMC event. To the upside is the intermediate 55-day Simple Moving Average (SMA) at 1.0097 ahead of the key 7-month resistance line near 1.0150 today. A move beyond the latter is needed to mitigate downside pressure and allow the Euro to face September’s high of 1.0197 (Sep 12) before possible further gains.
In the long term, the bearish view on the pair is expected to prevail as long as it trades below the 200-day SMA at 1.0716.
EUR/USD day chart
Source: Fx Street
With 6 years of experience, I bring to the table captivating and informative writing in the world news category. My expertise covers a range of industries, including tourism, technology, forex and stocks. From brief social media posts to in-depth articles, I am dedicated to creating compelling content for various platforms.


