
- The EUR/USD pair is trading directionlessly below the 1.0600 barrier.
- Further gains are expected above the 1.0640 area.
The pair EUR/USD it traded aimlessly below the key 1.0600 barrier on Friday.
Should the recovery pick up a more serious pace, the pair is expected to initially challenge the October high at 1.0639 (Oct 12). Breaking this zone would expose a possible move towards the transitory 55-day SMA at 1.0721, ahead of the weekly highs at 1.0736 (September 20) and 1.0767 (September 12).
Meanwhile, losses remain on the table as long as the pair navigates the zone below the key 200-day SMA at 1.0818.
EUR/USD Daily Chart
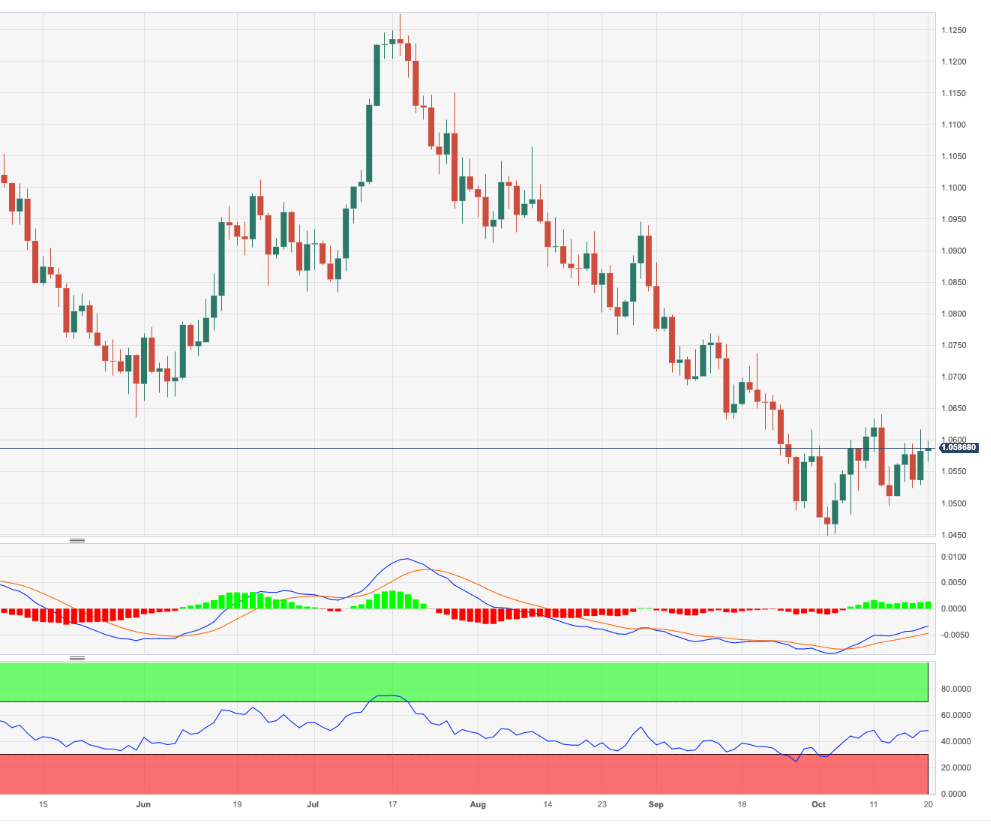
Source: Fx Street
I am Joshua Winder, a senior-level journalist and editor at World Stock Market. I specialize in covering news related to the stock market and economic trends. With more than 8 years of experience in this field, I have become an expert in financial reporting.


