
- EUR/USD extends the sharp drop driven by Powell to the 1.0520 zone.
- The next downside target emerges at the 2-month low near 1.0480.
He EUR/USD adds to Tuesday’s intense sell-off and hits fresh 2-month lows in the 1.0525/20 zone on Wednesday.
Continued selling pressure could force the pair to challenge the 2023 low at 1.0481 (Jan 6) before minor support at 1.0443 (7 Dec 2022 weekly low).
Longer-term, constructive view remains above the 200-day SMA at 1.0325 today.
EUR/USD daily chart
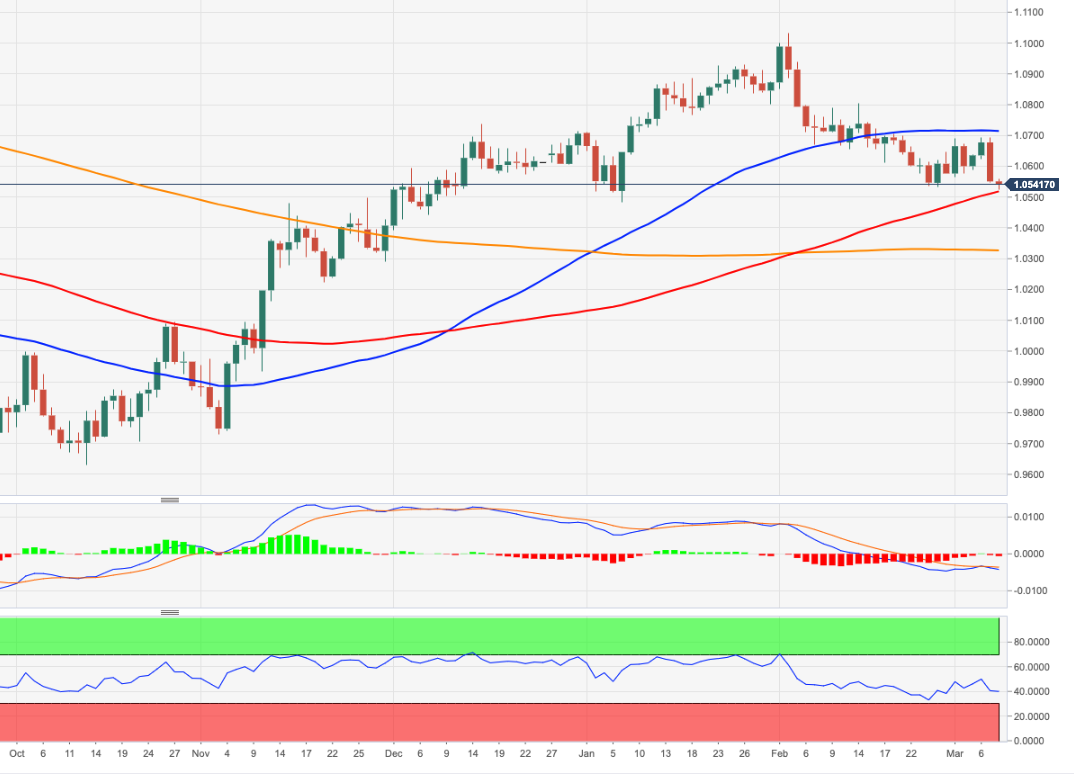
Source: Fx Street
I am Joshua Winder, a senior-level journalist and editor at World Stock Market. I specialize in covering news related to the stock market and economic trends. With more than 8 years of experience in this field, I have become an expert in financial reporting.


