
- EUR/USD faces a corrective decline and falls to 1.0860.
- The short-term uptrend remains above 1.0690.
EUR/USD pulls back for the second session in a row and revisits the 1.0860 zone on Friday.
As long as it remains above the short-term support line around 1.0690, the bias remains to the upside.
The continuation of the uptrend now needs to quickly break above the 2023 high at 1.0929 (Jan 26) to allow for a test of the weekly high at 1.0936 (21 Apr 2022). A sustainable break above this level could pave the way for a challenge of the key barrier at 1.1000 sooner rather than later.
Longer-term, the constructive view remains as long as it remains above the 200 SMA at 1.0309 today.
EUR/USD day chart
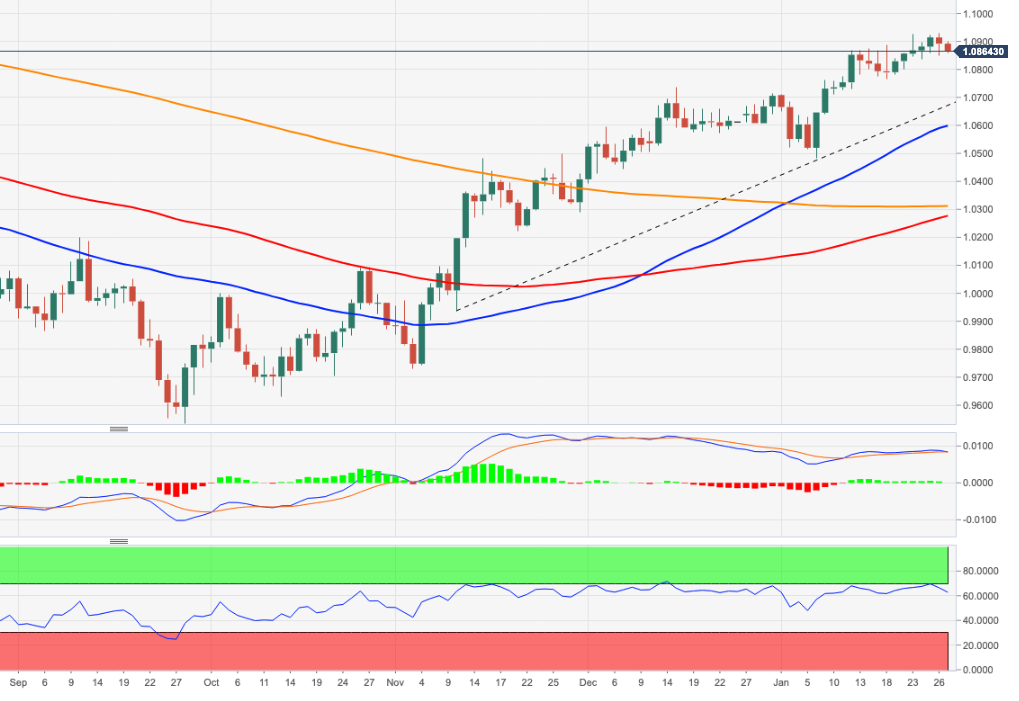
Source: Fx Street
I am Joshua Winder, a senior-level journalist and editor at World Stock Market. I specialize in covering news related to the stock market and economic trends. With more than 8 years of experience in this field, I have become an expert in financial reporting.


