
- EUR/USD could approach the 21-day EMA at 1.0727.
- A break below 1.0700 could take the pair towards the important support at 1.0650 and the April low at 1.0601.
- A break above the 1.0695 level suggests a weakening of the bearish sentiment.
EUR/USD recovers the losses recorded in the previous session and trades around 1.0720 during the European morning on Thursday. From a technical point of view, the analysis suggests a weakening of the bearish sentiment for the pair as it has broken above the important level of 1.0695 and the psychological level of 1.0700.
Furthermore, the MACD (Moving Average Convergence Divergence) lagging indicator indicates a change in momentum for EUR/USD as it positions below the center line, but above the signal line. However, the 14-day Relative Strength Index (RSI) remains below the 50 mark, indicating a continuation of the bearish momentum.
Key support for EUR/USD is likely to be around the psychological level of 1.0700. A break below this level could put downward pressure on the pair, potentially taking it towards the region surrounding the key 1.0650 support level. Another level of contention could be found around the April low at 1.0601, which aligns with the psychological level of 1.0600.
To the upside, the immediate barrier for the pair could be the 21-day EMA at 1.0727. Breaking above this level could push the EUR towards the 38.2% Fibonacci level at 1.0749, which lies between the levels of 1.0981 and 1.0606, coinciding with the key level of 1.0750.
EUR/USD: Daily Chart
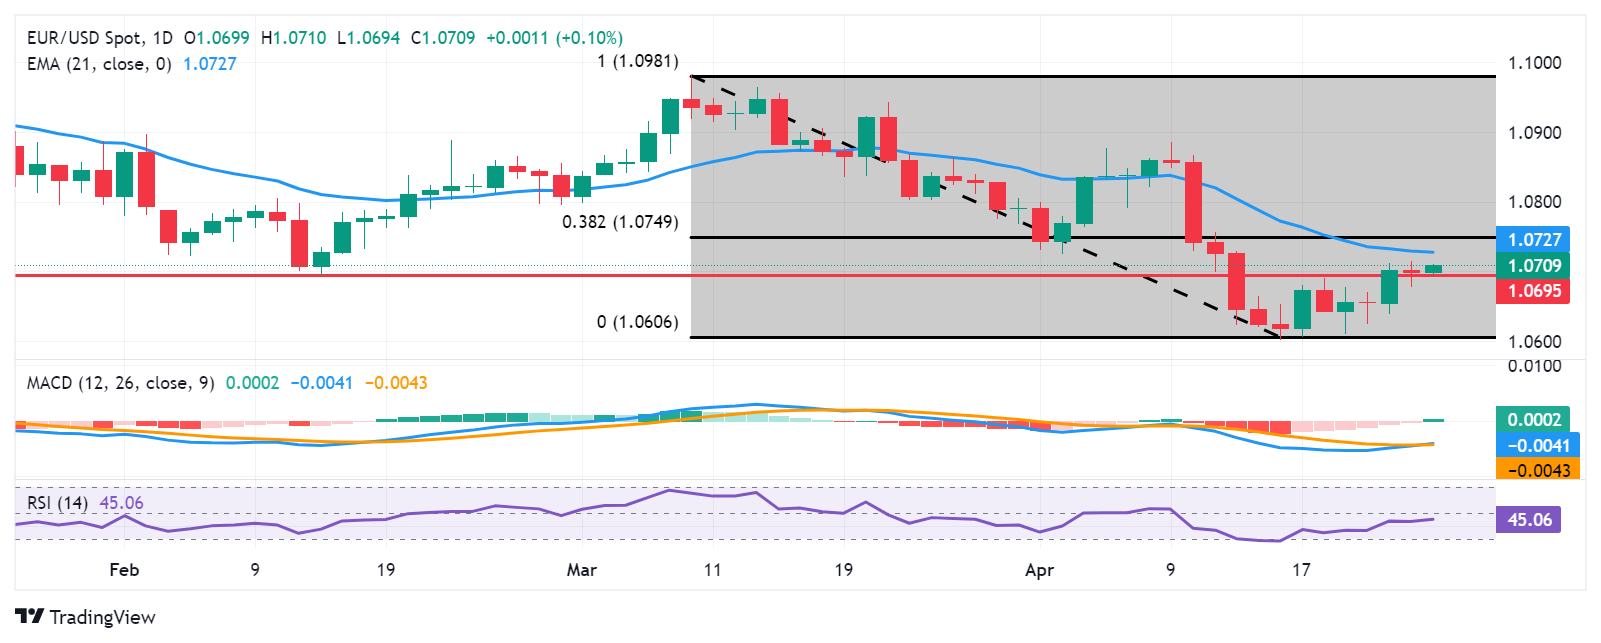
Source: Fx Street
I am Joshua Winder, a senior-level journalist and editor at World Stock Market. I specialize in covering news related to the stock market and economic trends. With more than 8 years of experience in this field, I have become an expert in financial reporting.


