
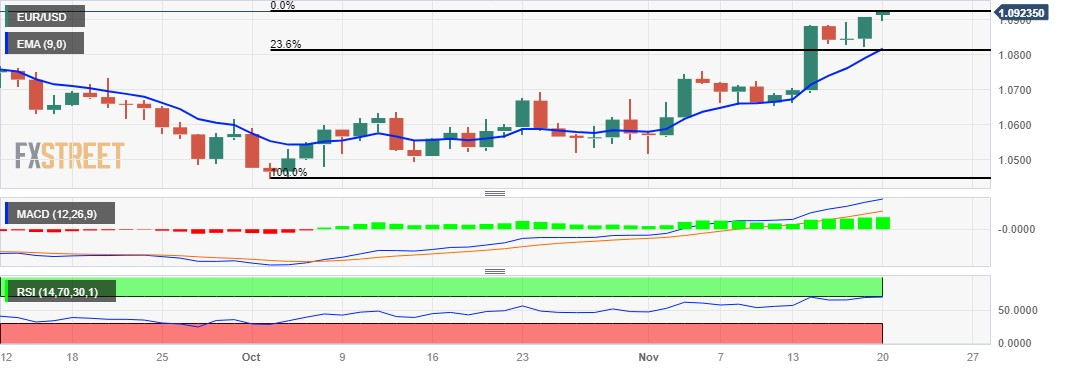
- EUR/USD could reach immediate resistance around the 1.0950 level.
- Technical indicators suggest stronger momentum; bulls could target August high at 1.1064.
- A firm break below 1.0900 could encourage the bears to target the 9-day EMA.
The EUR/USD pair continues its winning streak and during the Asian session on Monday it has traded around its three-month high just above 1.0920. The pair appears to be approaching immediate resistance around the 1.0950 level, while the US Dollar (USD) faces selling pressure on the likelihood that the Federal Reserve (Fed) has concluded its interest rate hike cycle .
A break above this last level will support the EUR/USD bulls to head towards the next barrier at the psychological level of 1.1000, before targeting the August high at 1.1064.
The ongoing bullish trend is supported by the pair’s technical indicators. The 14-day Relative Strength Index (RSI) above the 50 level signals bullish sentiment, indicating further momentum for the pair.
Furthermore, the MACD line is above the center line, with divergence above the signal line, suggesting bullish momentum in the EUR/USD pair.
To the downside, the psychological level at 1.0900 emerges as key support, before the next level at 1.0850. A firm break below that last level could pressure the EUR/USD pair to move around the region around the 9-day EMA at 1.0819, aligning with the 23.6% Fibonacci retracement at 1.0811.
EUR/USD daily chart
Source: Fx Street
I am Joshua Winder, a senior-level journalist and editor at World Stock Market. I specialize in covering news related to the stock market and economic trends. With more than 8 years of experience in this field, I have become an expert in financial reporting.


