
- EUR/USD faces further selling on Tuesday and is weighed down by a modest rally in the USD.
- The technical setup suggests that the path of least resistance is to the downside.
- Recovery attempts could be seen as a selling opportunity and are likely to remain limited.
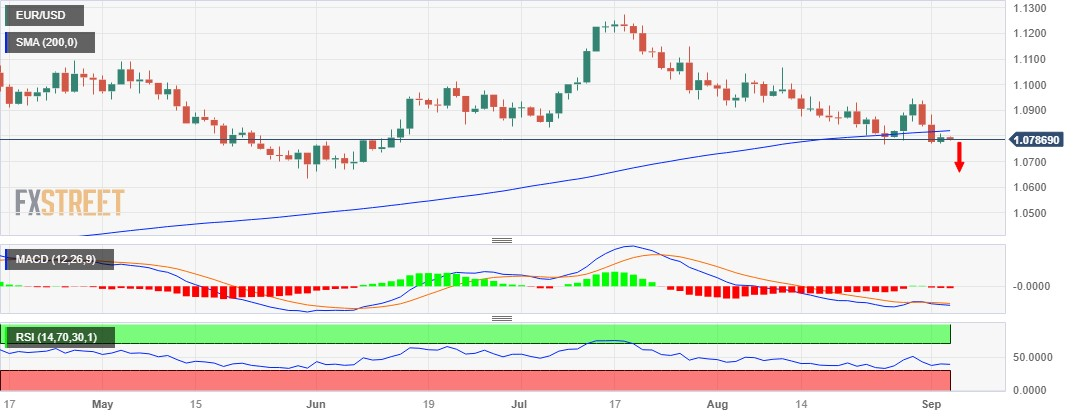
EUR/USD fails to take advantage of the previous day’s modest gains and attracts new sellers near the round 1.0800 level during the Asian session on Tuesday. The pair remains very close to lows in more than two months, around the 1.0765 area touched in July, and looks vulnerable below the technically significant 200-day SMA.
The negative outlook for the EUR/USD pair is reinforced by the fact that the oscillators on the daily chart remain in bearish territory and are still far from the oversold zone. That aside, the appearance of some buying around the US dollar (USD) suggests that the path of least resistance for the pair is to the downside. Therefore, a further drop to the 1.0765 area, on the way to the 1.0700 level, looks like a clear possibility.
The next relevant support is near the bottom around 1.0635. Next is the 1.0600 zone, which if broken decisively will become another trigger for the bears and pave the way for further losses. The EUR/USD pair could then become vulnerable and accelerate the decline towards the intermediate support of 1.0530-1.0525 before finally falling to the psychological level of 1.0500.
On the other hand, the rally above the 1.0800 level is likely to face stiff resistance near the 200-day SMA, currently around the 1.0815-1.0820 region. Sustained strength above this region could trigger a short-covering rally and allow the EUR/USD pair to recapture the 1.0900 level. However, any further move higher could be seen as a selling opportunity and remain capped near last week’s high around the 1.0840-1.0845 zone.
The latter should act as a turning point for EUR/USD, which if broken strongly will suggest that the recent sharp pullback from the 1.1275 area, or a 17-month high hit in July, has come to an end. This, in turn, will set the stage for some significant appreciation in the near term.
EUR/USD daily chart
EUR/USD additional technical levels
Source: Fx Street
I am Joshua Winder, a senior-level journalist and editor at World Stock Market. I specialize in covering news related to the stock market and economic trends. With more than 8 years of experience in this field, I have become an expert in financial reporting.


