
- The EUR/USD pair is trading up and down around 1.0850.
- The next bullish barrier could be 1.0945.
The EUR/USD pair is trading without a clear direction around 1.0800 after Thursday’s daily decline.
Continuation of the bullish bias could see the weekly high of 1.0945 (Aug 30) revisited sooner rather than later. Once surpassed, spot could challenge the psychological threshold of 1.1000.
For now, as long as it remains above the important 200-day SMA, today at 1.0803, the pair’s outlook should remain constructive.
EUR/USD Daily Chart
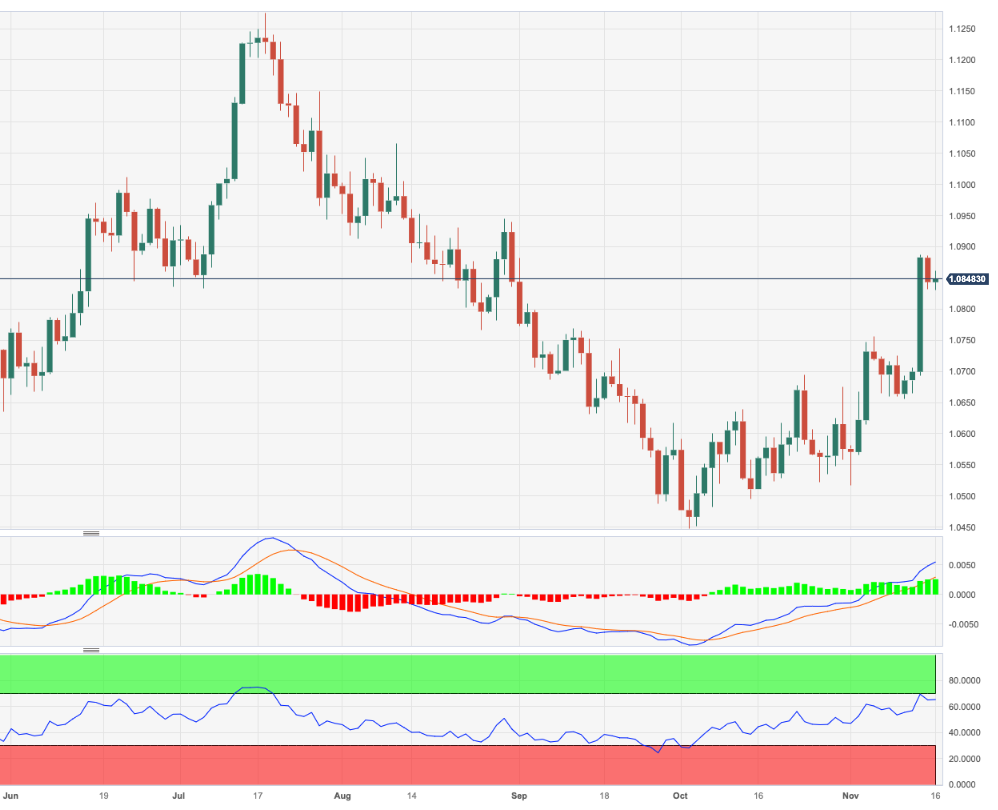
Source: Fx Street
I am Joshua Winder, a senior-level journalist and editor at World Stock Market. I specialize in covering news related to the stock market and economic trends. With more than 8 years of experience in this field, I have become an expert in financial reporting.


