
- EUR/USD extends Wednesday’s rally beyond parity.
- The rallies could accelerate to the minor hurdle of 1.0090.
EUR/USD extends bullish sentiment beyond the parity zone ahead of the European Central Bank’s decision on Thursday.
If it continues to rise, it could retest the weekly high of 1.0090 (Aug 26) in the short term, before reaching the intermediate hurdle of the 55-day simple moving average (SMA) at 1.0162. Downside pressure could be eased if the seven-month resistance line is breached, today near 1.0210.
In the long term, the bearish view on the pair is expected to prevail as long as it trades below the 200-day SMA at 1.0767.
EUR/USD day chart
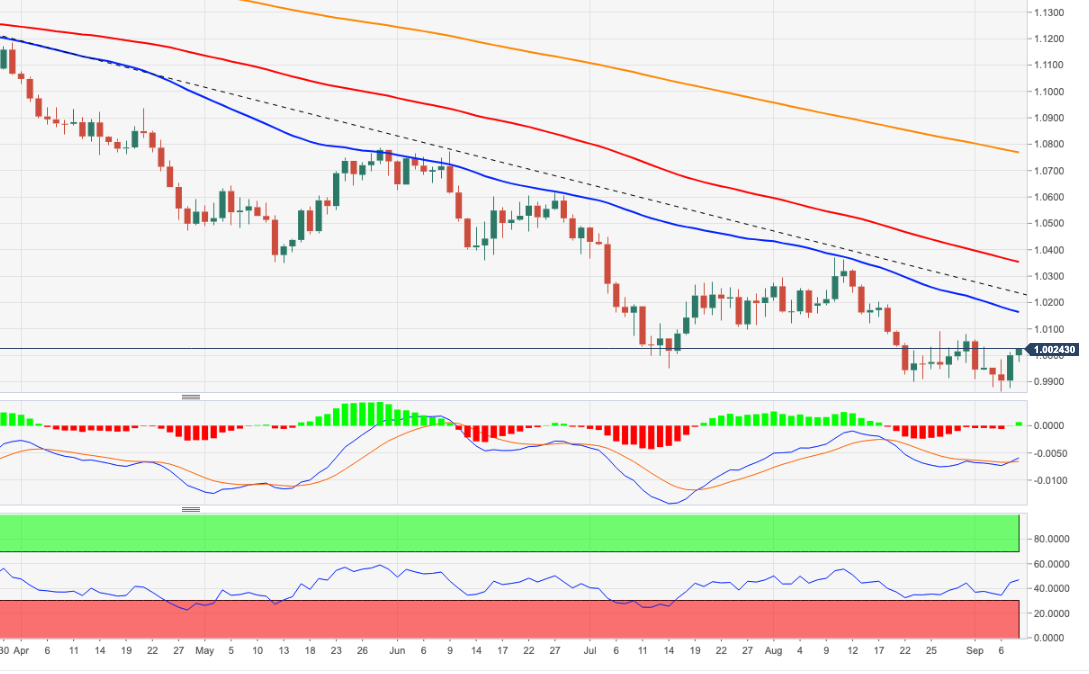
Source: Fx Street
With 6 years of experience, I bring to the table captivating and informative writing in the world news category. My expertise covers a range of industries, including tourism, technology, forex and stocks. From brief social media posts to in-depth articles, I am dedicated to creating compelling content for various platforms.


