
- EUR/USD continues positive start to the week above parity.
- Firm resistance is seen near the 1.0100 area so far.
The EUR/USD hits two-day highs north of the parity barrier on Tuesday.
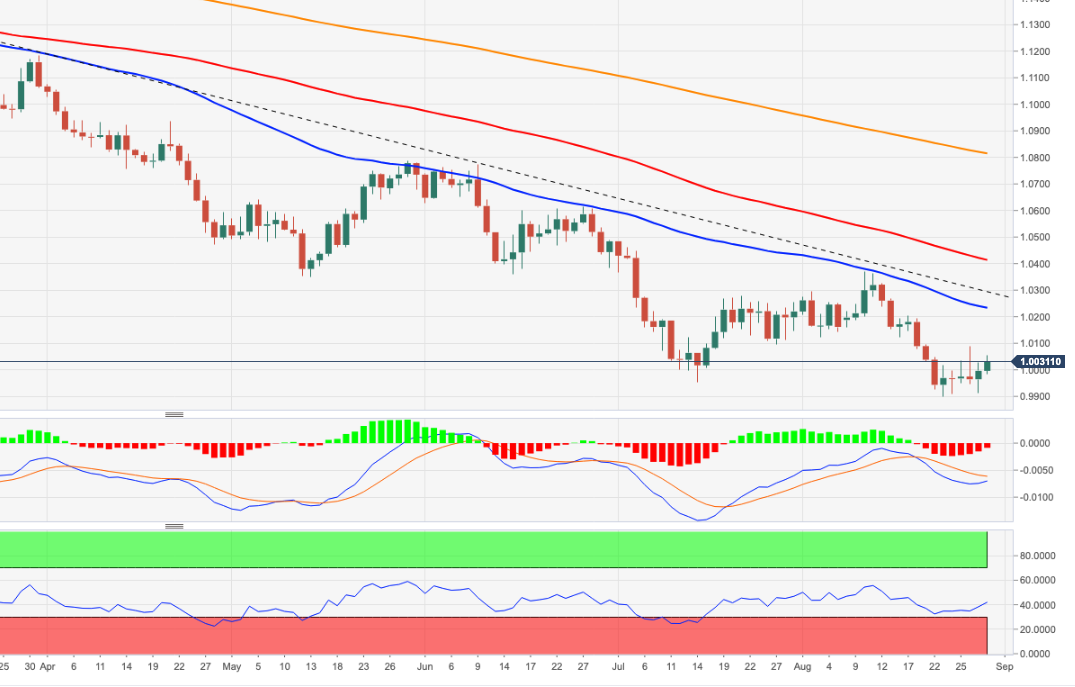
At the moment, it looks like the pair may continue to rise. Therefore, the recent weekly high at 1.0090 (Aug 26) now emerges as the next major hurdle before another weekly high at 1.0202 (Aug 17).
In the long term, the bearish view on the pair is expected to prevail as long as it trades below the 200-day SMA at 1.0813.
EUR/USD daily chart
Source: Fx Street
With 6 years of experience, I bring to the table captivating and informative writing in the world news category. My expertise covers a range of industries, including tourism, technology, forex and stocks. From brief social media posts to in-depth articles, I am dedicated to creating compelling content for various platforms.


