
- EUR/USD shows decent support in the area above 1.0700.
- The resumption of the downtrend could retest 1.0635.
He EUR/USD It bounces from 2-month lows in the 1.0630 zone and recovers to the zone just above 1.0700, today, Thursday.
The pair remains under strong pressure and a break of the May low at 1.0635 (May 31) could pave the way for a drop to 1.0600 ahead of the March low at 1.0516 (March 15).
A deeper pullback to the 2023 low at 1.0496 (Jan 6) would likely require a sharp deterioration in the outlook, which does not look favorable at the moment.
Longer-term, constructive view remains above the 200-day SMA at 1.0492 today.
EUR/USD daily chart
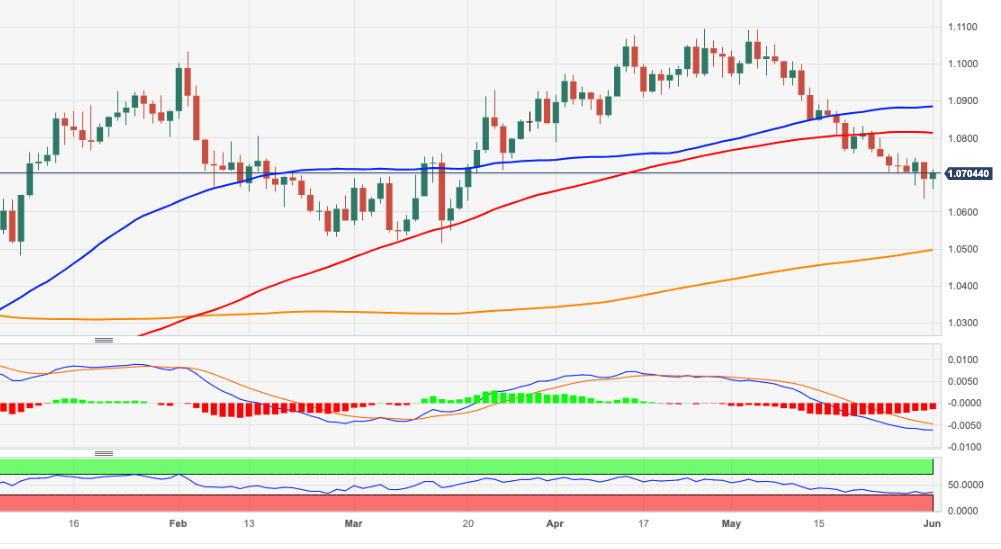
Source: Fx Street
I am Joshua Winder, a senior-level journalist and editor at World Stock Market. I specialize in covering news related to the stock market and economic trends. With more than 8 years of experience in this field, I have become an expert in financial reporting.


