
- EUR/USD has seen bullish momentum peter out amid a rally in the USD index.
- The ECB will continue to raise rates despite the economic outlook for the Eurozone.
- The EUR/USD pair’s rally move has seen it break above the 61.8% Fib retracement at 1.0738.
EUR/USD has shown some exhaustion in bullish momentum after rallying near 1.0780 in the European session. The pair has found intermediate resistance due to an extension in the Dollar Index (DXY) rally.
The Dollar Index has stretched its recovery to near 103.60, however the downtrend looks favored as US labor market conditions are easing and offer room for the Federal Reserve (Fed) to hold steady interest rates in June.
The corrective move in the Euro could end sooner as the European Central Bank (ECB) is expected to continue raising interest rates despite growing fears of a recession in the Eurozone.
EUR/USD’s rally move has seen it break above the 61.8% Fibonacci retracement (plotted from the 15th Mar low at 1.0516 to the 26th Apr high at 1.1095) at 1.0738. For sentiment to be positive, the Euro has to go through a lot of filters.
A bullish crossover, represented by the 20 and 50 period EMAs at 1.0724, is added to the bullish filters.
Also, the Relative Strength Index (RSI) (14) has drifted into the bullish range of 60.00-80.00, indicating that upside momentum has been activated.
A further correction near the May 30 high at 1.0746 would trigger a buying opportunity, taking the asset towards the June 2 high of 1.0779 followed by round level resistance at 1.0800.
In an alternate scenario, the downside will resume if the currency pair falls below the June 5 low at 1.0675. This would drag the asset towards the May 31 low at 1.0635 followed by the March 3 low at 1.0588.
EUR/USD four-hour chart
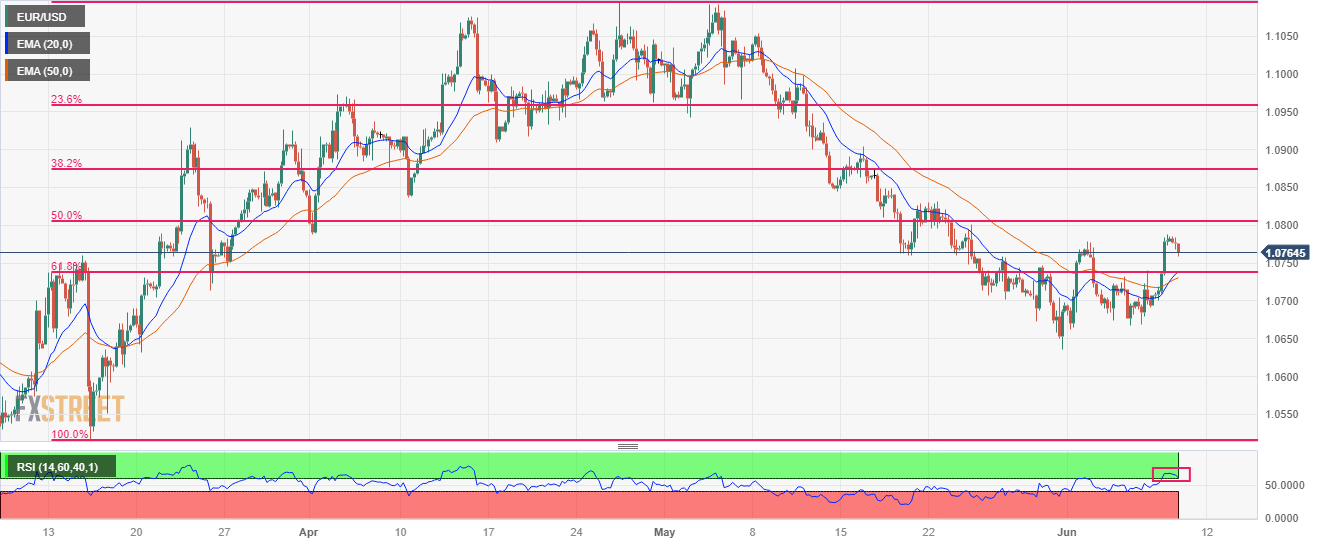
Source: Fx Street
I am Joshua Winder, a senior-level journalist and editor at World Stock Market. I specialize in covering news related to the stock market and economic trends. With more than 8 years of experience in this field, I have become an expert in financial reporting.
”")


