
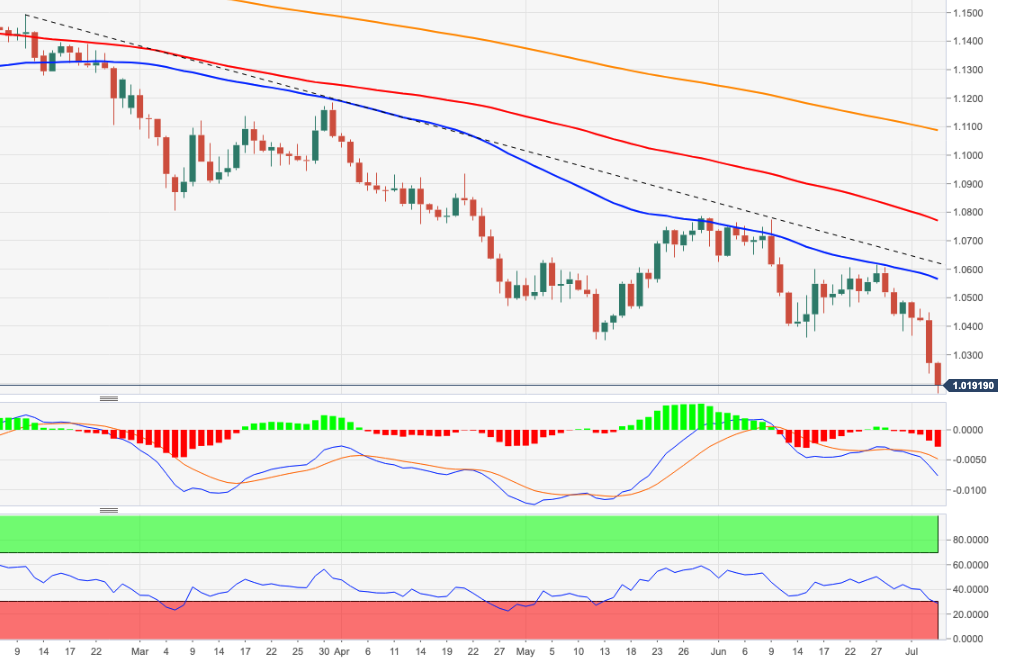
- EUR/USD sets new lows in the 1.0200 area.
- The pair enters oversold territory and could trigger a bounce.
The EUR/USD loses more ground and falls to almost two-decade lows in the 1.0170 zone on Monday.
The pair’s selling holds across the board, but tapers off mid-week amid an increasingly negative outlook. Against, there is a minor support level at 1.0060 (11 Dec 2002 low). A breakout of the latter should herald a visit to the key parity zone.
Longer term, the bearish view on the pair is expected to prevail as long as it trades below the 200-day SMA at 1.1085.
EUR/USD daily chart
Technical levels
Source: Fx Street
With 6 years of experience, I bring to the table captivating and informative writing in the world news category. My expertise covers a range of industries, including tourism, technology, forex and stocks. From brief social media posts to in-depth articles, I am dedicated to creating compelling content for various platforms.


