
- EUR/USD reverses course and sinks into the parity zone.
- Loss of that level could expose the all-time low at 0.9863.
The EUR/USD reverses sharply from recent advance and drops quickly to revisit near parity psychological level on Tuesday.
The continuation of the pullback threatens to break that important containment zone and pave the way for a potential challenge of the 2022 low at 0.9863 (Sep 6).
Longer term, the bearish view on the pair is expected to prevail as long as it trades below the 200-day SMA at 1.0748.
EUR/USD daily chart
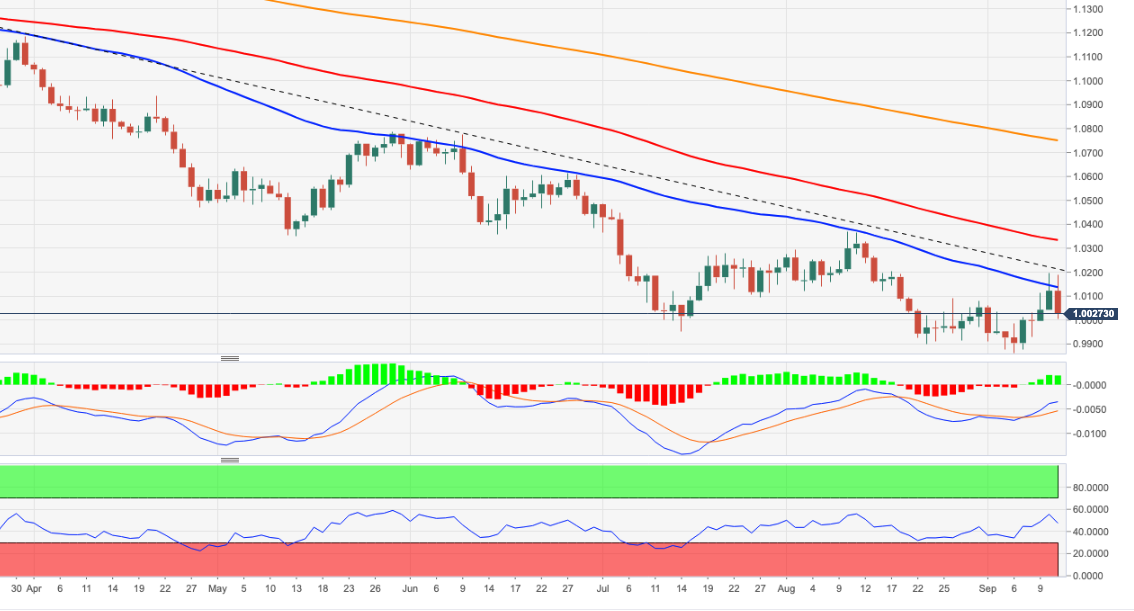
Technical levels
Source: Fx Street
With 6 years of experience, I bring to the table captivating and informative writing in the world news category. My expertise covers a range of industries, including tourism, technology, forex and stocks. From brief social media posts to in-depth articles, I am dedicated to creating compelling content for various platforms.


