
- EUR/USD regains positive traction on Wednesday and breaks a three-day losing streak.
- A modest decline in the dollar provides support pending US data and FOMC minutes.
- A convincing break below the 50% Fibonacci retracement could shift the bias in favor of the bears.
EUR/USD has attracted some buying during the Asian session on Wednesday and so far appears to have snapped a three-day streak of losses to one-week lows hit the previous day. The pair is currently hovering around the 1.0960 area, up just over 0.15% on the day, and remains at the mercy of the price dynamics of the US Dollar (USD).
The DXY Dollar Index, which measures the strength of the dollar against a basket of currencies, has lost some of Tuesday's strong gains amid repositioning trade ahead of important US macroeconomic data and minutes. of the December FOMC meeting. Meanwhile, doubts about an early rate cut by the Federal Reserve (Fed) could stop traders from opening aggressive bearish positions on the Dollar and keep gains in the EUR/USD pair at bay.
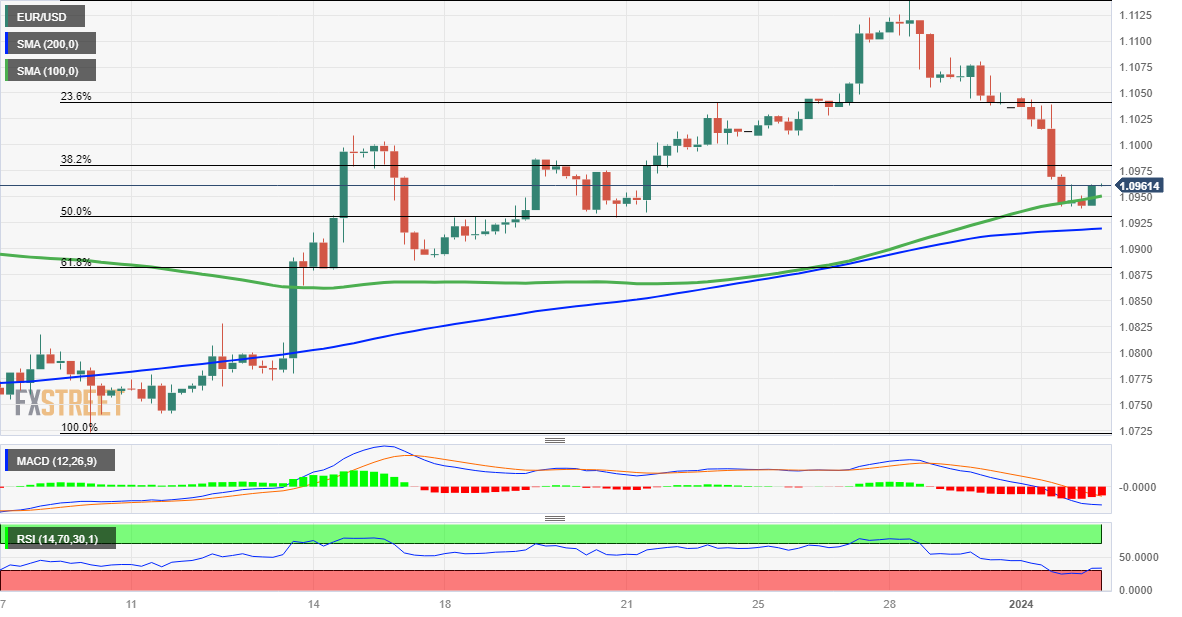
From a technical point of view, the pair showed some resistance below the 100 SMA on the 4-hour chart and found decent support near the 50% Fibonacci retracement of the 11-11 rally. December 28th. This level is located near the 1.0940 area and should now act as a key point, which if broken should pave the way for an extension of the pullback from the 1.1135-1.1140 area, a five-month high touched last week.
The EUR/USD pair could then weaken below the 200-4-hour SMA, currently around the 1.0920 area, and the round 1.0900 level, towards the test of the 61.8% Fiboancci, around to the 1.0885-1.0880 area. A continuation of the selling could trigger new bearish momentum and drag the pair towards the intermediate support of 1.0835-1.0830, on the way to the 1.0800 and 1.0765-1.0760 zone.
Meanwhile, the oscillators on the daily chart, although they have been losing traction, remain in positive territory and favor the bulls. That said, any further intraday move higher is likely to face some resistance near the 1.0980 area. This zone is closely followed by the psychological level of 1.1000, above which the EUR/USD pair could climb to the 1.1040-1.1045 zone on its way towards the 1.1080-1.1085 zone before attempting to reclaim the round 1.1100 level. .
EUR/USD 4-hour chart
EUR/USD additional technical levels
Source: Fx Street
I am Joshua Winder, a senior-level journalist and editor at World Stock Market. I specialize in covering news related to the stock market and economic trends. With more than 8 years of experience in this field, I have become an expert in financial reporting.
")


