
- EUR/USD attracts buyers for the second day in a row and moves away from lows in more than a month.
- The setup favors the bears and supports the prospects for fresh selling at higher levels.
- Lowering expectations for a Fed rate cut in March favors USD bulls and should help limit the pair's gains.
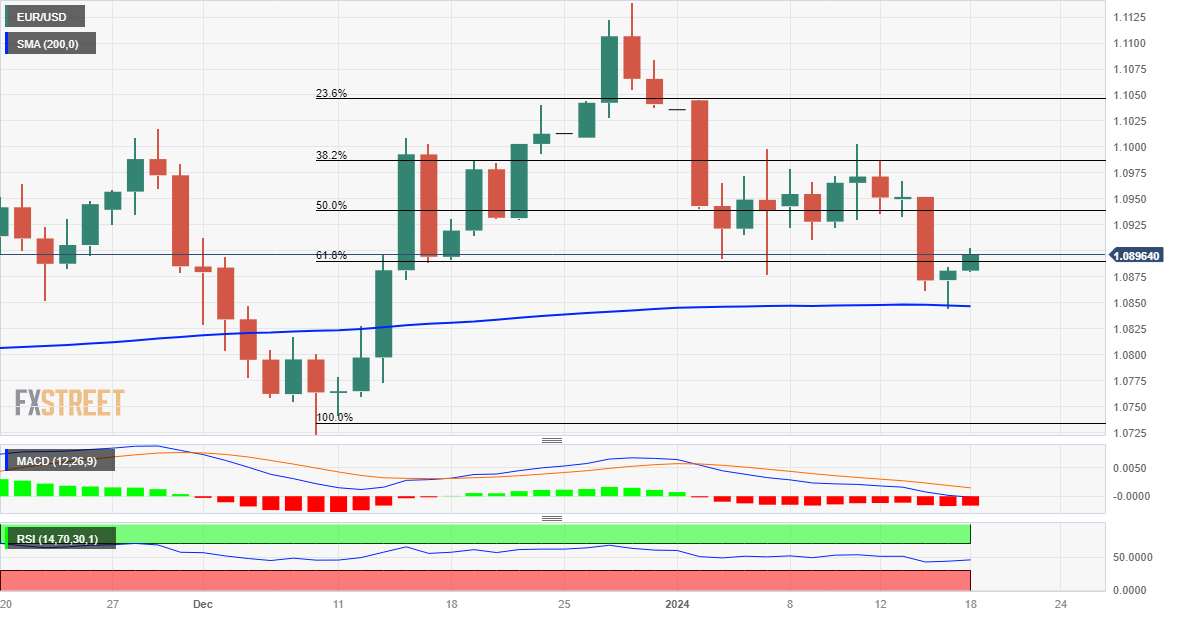
The EUR/USD pair extends the previous day's bounce from the important 200-day SMA support near the 1.0845 area and gains some positive traction for the second day in a row on Thursday. However, the pair is struggling to capitalize on the move above the 1.0900 round level, warranting some caution before positioning for any further gains amid the underlying bullish tone around the US Dollar (USD).
Wednesday's release of better-than-expected U.S. retail sales numbers pointed to still resilient consumer spending and suggested the economy is in good shape. This gives the Federal Reserve (Fed) more room to maneuver to keep interest rates “higher for longer” and forces investors to further trim their expectations for a rate cut in March. The bullish outlook continues to support elevated US Treasury yields, which favors dollar bulls and should limit any significant appreciative move for the EUR/USD pair.
Meanwhile, the oscillators on the daily chart have just entered negative territory. This, along with the recent breakout of a short-term operating range, supports the prospects of new sellers emerging at higher levels. The breaking point of the operating range support, around the 1.0920 area, now appears to act as a strong immediate barrier. However, some follow-through buying could trigger a short-term recovery and allow the EUR/USD pair to make a new attempt to conquer the psychological level of 1.1000.
On the opposite side, the technically significant 200-day SMA, currently around the 1.0845 area, could continue to protect the immediate downside. A convincing break below that level would be a new trigger for the bears and expose the support of the 100-day SMA, near the 1.0785 area. The decline could extend further and drag the EUR/USD pair towards the lows around 1.0725-1.0720.
EUR/USD Daily Chart
EUR/USD additional technical levels
Source: Fx Street
I am Joshua Winder, a senior-level journalist and editor at World Stock Market. I specialize in covering news related to the stock market and economic trends. With more than 8 years of experience in this field, I have become an expert in financial reporting.


