
- EUR/USD could test 1.0700 level after the 1.0601 retracement support level.
- Technical analysis of the daily chart suggests a bearish trend for the pair.
- The immediate barrier appears at the lower boundary of the rectangle formation around the 50-day EMA at 1.0802.
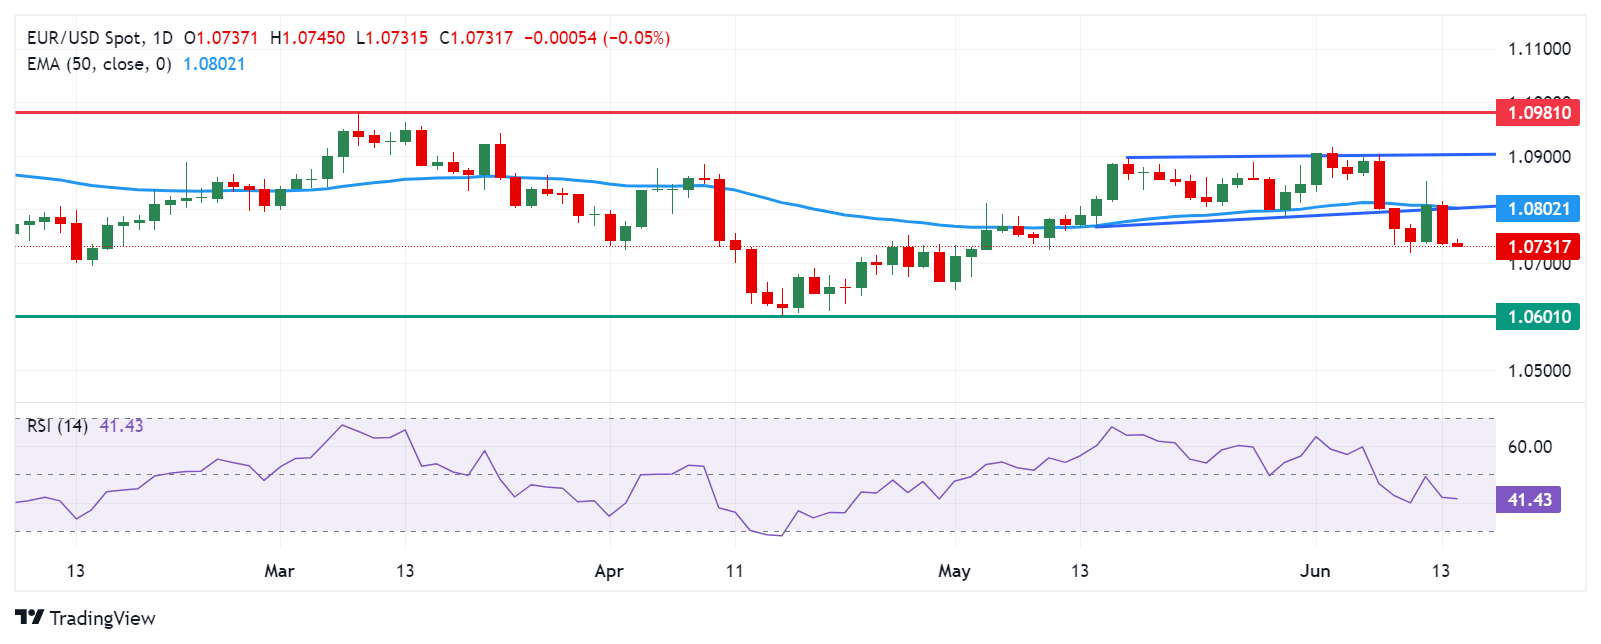
EUR/USD extends its losses for the second day in a row, trading around 1.0730 in the early part of Friday. A technical analysis of a daily chart suggests a bearish trend for the pair as it struggles below the lower threshold of a rectangle formation.
Furthermore, the 14-day Relative Strength Index (RSI) momentum indicator is positioned below the 50 level, suggesting a confirmation of a bearish trend for the EUR/USD pair.
The EUR/USD pair could find immediate support at the psychological level of 1.0700. A break below this level could put downward pressure on the pair to test the 1.0601 retracement support level.
To the upside, the EUR/USD pair could retest the lower boundary of the rectangle formation around the 50-day Exponential Moving Average (EMA) at 1.0802. A return to the rectangle formation could weaken the downtrend and strengthen the pair to explore the psychological level of 1.0900, aligned with the upper boundary of the rectangle formation around the 1.0905 level.
A break above this last level could support the pair to explore the region around the March high of 1.0981.
EUR/USD: Daily Chart
Source: Fx Street
I am Joshua Winder, a senior-level journalist and editor at World Stock Market. I specialize in covering news related to the stock market and economic trends. With more than 8 years of experience in this field, I have become an expert in financial reporting.


