
- EUR/USD loses bullish momentum after rising to 1.0030.
- It looks like the 0.9900 area can be retested.
The EUR/USD Quickly loses previous upside momentum to area north of parity level, or new 3-day highs.
The lack of conviction from the previous bullish attempt leaves the door open for a resumption of the downtrend. On the contrary, in the not too distant future a new visit to the lows of the cycle around 0.9900 is expected. A drop below the 2022 low of 0.9899 (Aug 23) could lead to a deeper pullback to the Dec 2002 low of 0.9859.
In the long term, the bearish view on the pair is expected to prevail as long as it trades below the 200-day SMA at 1.0832.
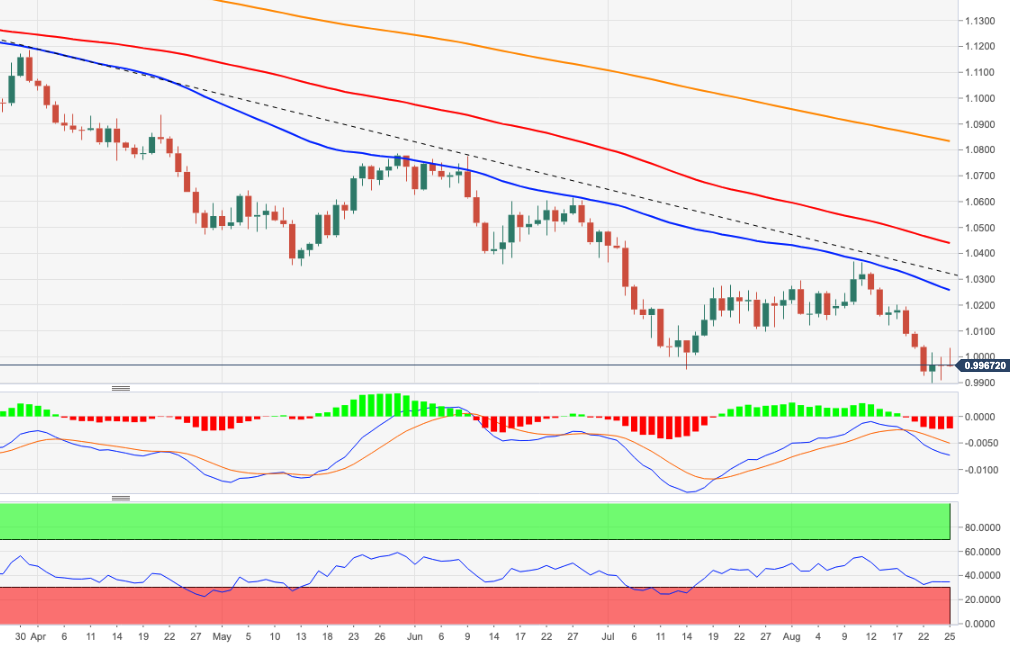
EUR/USD daily chart
Technical levels
Source: Fx Street
With 6 years of experience, I bring to the table captivating and informative writing in the world news category. My expertise covers a range of industries, including tourism, technology, forex and stocks. From brief social media posts to in-depth articles, I am dedicated to creating compelling content for various platforms.


