
- EUR/USD recovers some of the ground lost in Wednesday’s decline.
- The 8-month resistance line caps the upside near 0.9960.
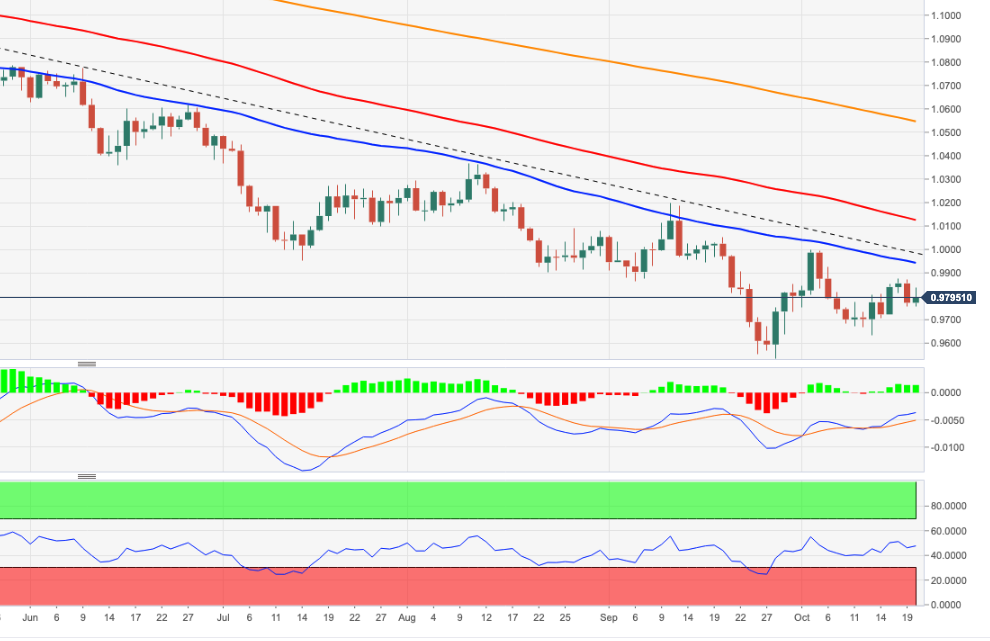
The EUR/USD regains some composure and trades near the 0.9800 area on Thursday.
Should the bounce continue, the pair faces a temporary hurdle at the 55-day SMA, today at 0.9941, ahead of the more relevant 8-month resistance line around 0.9960. Breaking above the latter is needed to mitigate downside pressure and trigger a longer and more serious recovery to initially the October high of 0.9999 (Oct 4).
In the longer term, the bearish view on the pair should remain unchanged as long as it is below the 200-day SMA at 1.0544.
EUR/USD daily chart
Source: Fx Street
With 6 years of experience, I bring to the table captivating and informative writing in the world news category. My expertise covers a range of industries, including tourism, technology, forex and stocks. From brief social media posts to in-depth articles, I am dedicated to creating compelling content for various platforms.


