
- EUR/USD crashes and falls to fresh 9-1/2-week lows.
- A deeper drop to the 2023 low should now not be ruled out.
He EUR/USD comes under strong selling pressure and fully reverses last week’s strong rebound, dipping to fresh 9.5-week lows at 1.0522.
The pronounced sell-off carries the potential for the pair to retest the 2023 low near 1.0480 (Jan 6) before rushing to the key 200-day SMA today at 1.0323.
Longer-term, the bullish view continues as long as it stays above the 200-day SMA.
EUR/USD daily chart
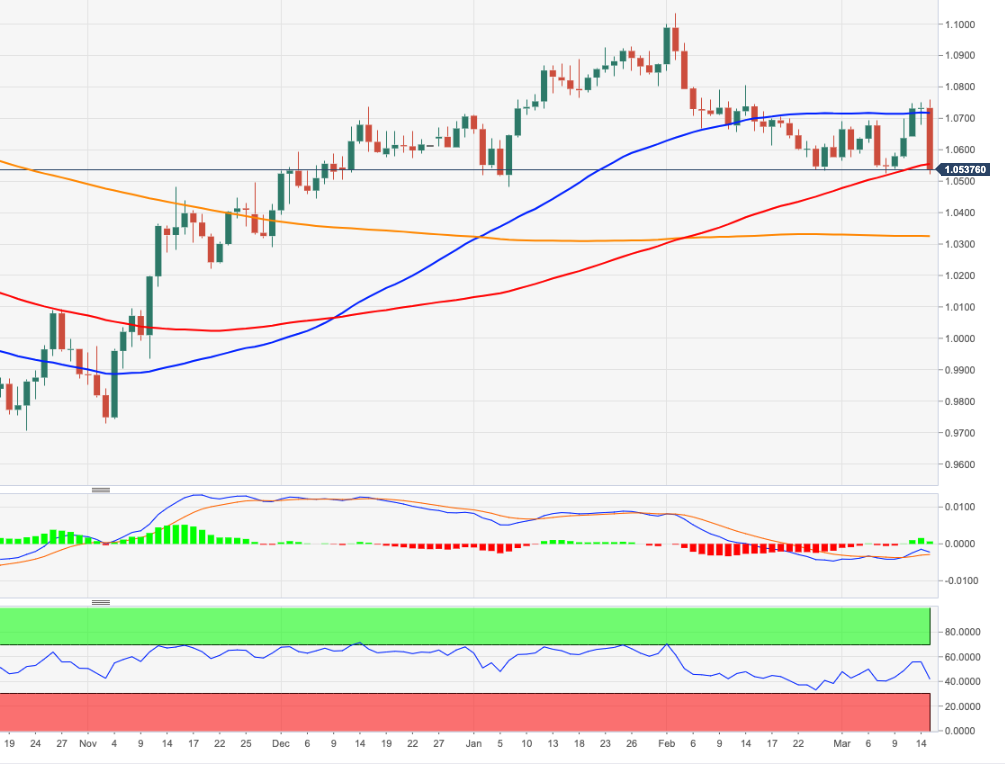
Source: Fx Street
I am Joshua Winder, a senior-level journalist and editor at World Stock Market. I specialize in covering news related to the stock market and economic trends. With more than 8 years of experience in this field, I have become an expert in financial reporting.


