
- EUR/USD bounces sharply off the 1.0400 level.
- The 5-month line near 1.0630 caps the upside so far.
The EUR/USD extends the bounce from last week’s lows in the 1.0385/80 zone on Monday.
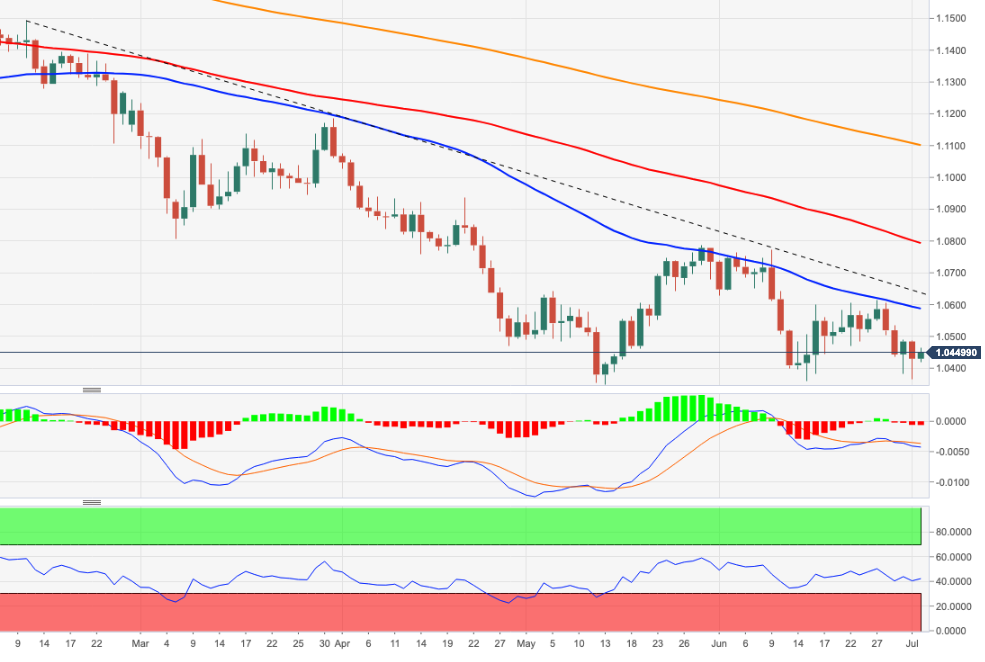
The pair’s inability to break out of the 5-month line near 1.0630 convincingly should keep the bearish pressure on the pair for now. That said, there is a little support at the weekly low of 1.0365 (July 1) before the June low at 1.0358 (June 15). A deeper pullback should put a visit to the 2022 low at 1.0348 (13 May) back on the radar.
In the long term, the bearish view on the pair is expected to prevail as long as it trades below the 200-day SMA at 1.1099.
EUR/USD daily chart
Technical levels
Source: Fx Street
With 6 years of experience, I bring to the table captivating and informative writing in the world news category. My expertise covers a range of industries, including tourism, technology, forex and stocks. From brief social media posts to in-depth articles, I am dedicated to creating compelling content for various platforms.


