
- EUR/USD maintains its position above the psychological level of 1.0700 amid a momentum shift towards an uptrend.
- The immediate barrier appears around the main level of 1.0750, aligned with the upper boundary of the descending channel.
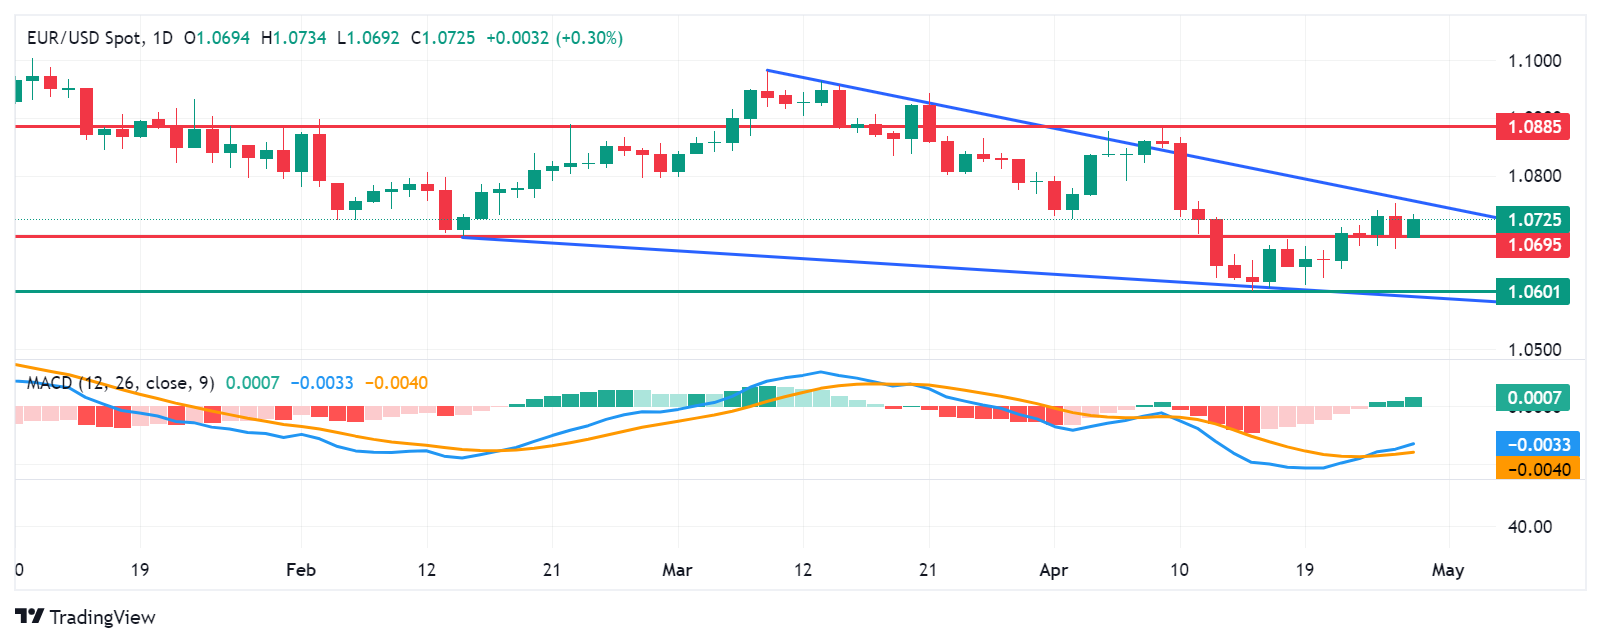
- A break below 1.0700 could take the pair towards the 1.0650 support level and the April low of 1.0601.
EUR/USD recovers recent losses recorded in the previous session and is trading around 1.0720 on Monday morning. From a technical perspective, the analysis indicates a weakening of the bearish sentiment for the pair as it continues to advance within the descending channel, surpassing the key psychological level of 1.0700.
Furthermore, the MACD (Moving Average Convergence Divergence) lagging indicator suggests a shift towards bullish momentum for EUR/USD. Although it is positioned below the center line, it shows divergence above the signal line.
EUR/USD faces an immediate barrier at 1.0750, which corresponds to the upper boundary of the descending channel. If it breaks this level, the pair could gain bullish momentum and head towards the area near the psychological level of 1.0800, followed by the April high at 1.0885.
On the downside, key support for the pair is anticipated around the psychological threshold of 1.0700, coinciding with the important support 1.0695. A break below this level could put downward pressure on the pair, potentially taking it towards the vicinity of 1.0650. Other support levels could emerge around the April low at 1.0601, aligned with the lower boundary of the descending channel.
EUR/USD: Daily Chart
Source: Fx Street
I am Joshua Winder, a senior-level journalist and editor at World Stock Market. I specialize in covering news related to the stock market and economic trends. With more than 8 years of experience in this field, I have become an expert in financial reporting.


