
- EUR/USD appears offered but remains above 1.0700.
- The 1.0790 region remains a tough barrier for the bulls thus far.
EUR/USD is trading within the daily range in the context of a resurgence in demand for the dollar.
Breaking out of the 1.0780/90 band, where the 3-month resistance line and the May high meet, should see bearish pressure eased and this could lead to a new burst of strength in the near term. If this zone is broken, the next target to watch emerges at the weekly high of 1.0936 (April 21).
In the longer term, the bearish view of the pair is expected to prevail as long as it trades below the 200 SMA at 1.1232.
EUR/USD day chart
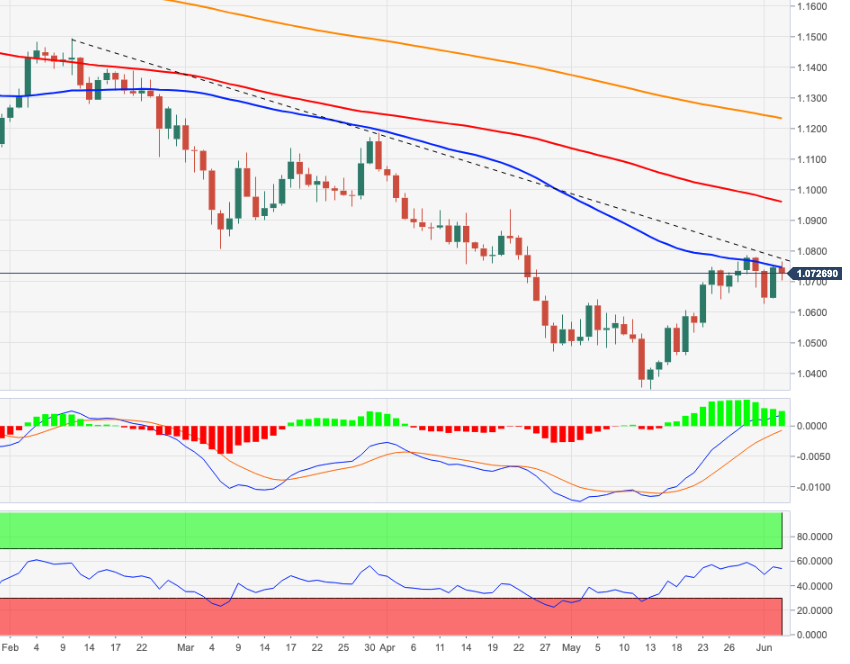
Source: Fx Street
With 6 years of experience, I bring to the table captivating and informative writing in the world news category. My expertise covers a range of industries, including tourism, technology, forex and stocks. From brief social media posts to in-depth articles, I am dedicated to creating compelling content for various platforms.


