
- The EUR/USD pair remains below the key 1.1000/1.1018 resistance zone, hampered by the 20-day EMA and a trend line of resistance from a month ago.
- The currency pair is trading at 1.1007, showing a slight decline of 0.01% ahead of the Wall Street closing bell.
- Despite the emergence of a three candlestick pattern suggesting bullish momentum, Monday’s doji formation indicates indecision among buyers.
- Key resistance stands at 1.1020, with potential movement towards 1.1055 and 1.1095, while support lies at 1.0947 and 1.0933.
The EUR/USD pair erases some of its previous losses but remains constrained by the intersection of the 20-day EMA with a trend line of resistance around the 1.1000/1.1018 zone. The EUR/USD pair is trading at 1.1007, down 0.01% before the close on Wall Street.
EUR/USD Price Analysis: Technical Perspective
From a daily chart perspective, EUR/USD should head higher as a three candlestick pattern is in place. However, Monday’s price action forming a doji indicates that buyers are struggling to gain momentum, which could send sellers losing control if EUR/USD falls below 1.1000.
From a short-term standpoint, EUR/USD is trending higher, but a month-old resistance trend line would be difficult to break above as the pair advances. A break of 1.1020 would bring the daily R1 pivot into play at 1.1055, followed by the April 26 high at 1.1095 before 1.1100.
On the other hand, if EUR/USD falls below 1.1000, the next support would be the S1 pivot point at 1.0947, followed by last Friday’s low at 1.0933. Failure to break above this last point could lead to a bullish correction, as EUR/USD may not make a new lower low. A continuation could pave the way to challenge 1.0900.
EUR/USD Price Action – Hourly Chart
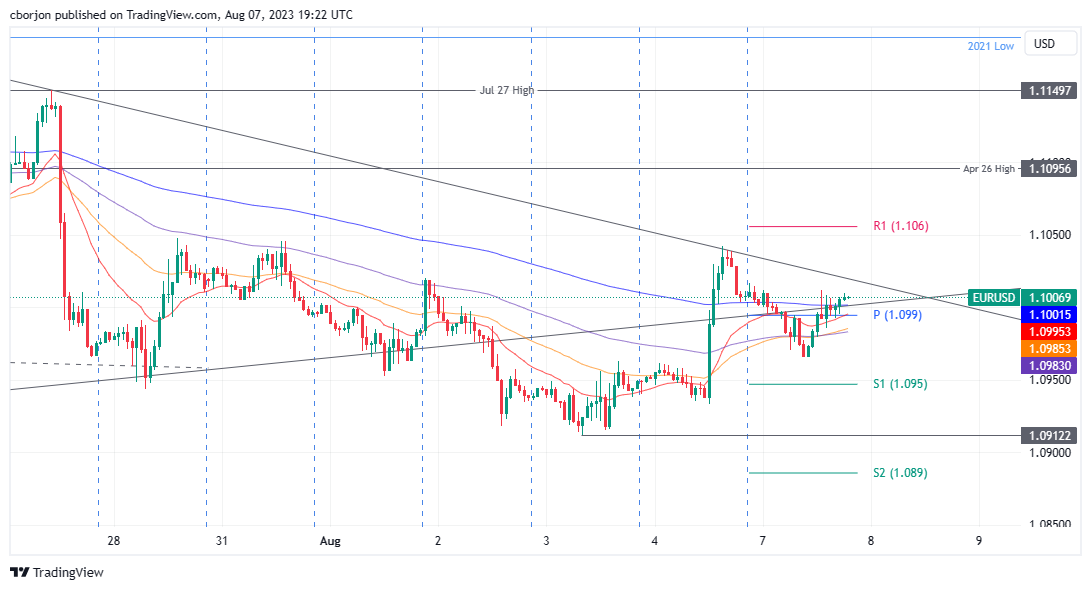
Source: Fx Street
I am Joshua Winder, a senior-level journalist and editor at World Stock Market. I specialize in covering news related to the stock market and economic trends. With more than 8 years of experience in this field, I have become an expert in financial reporting.


