
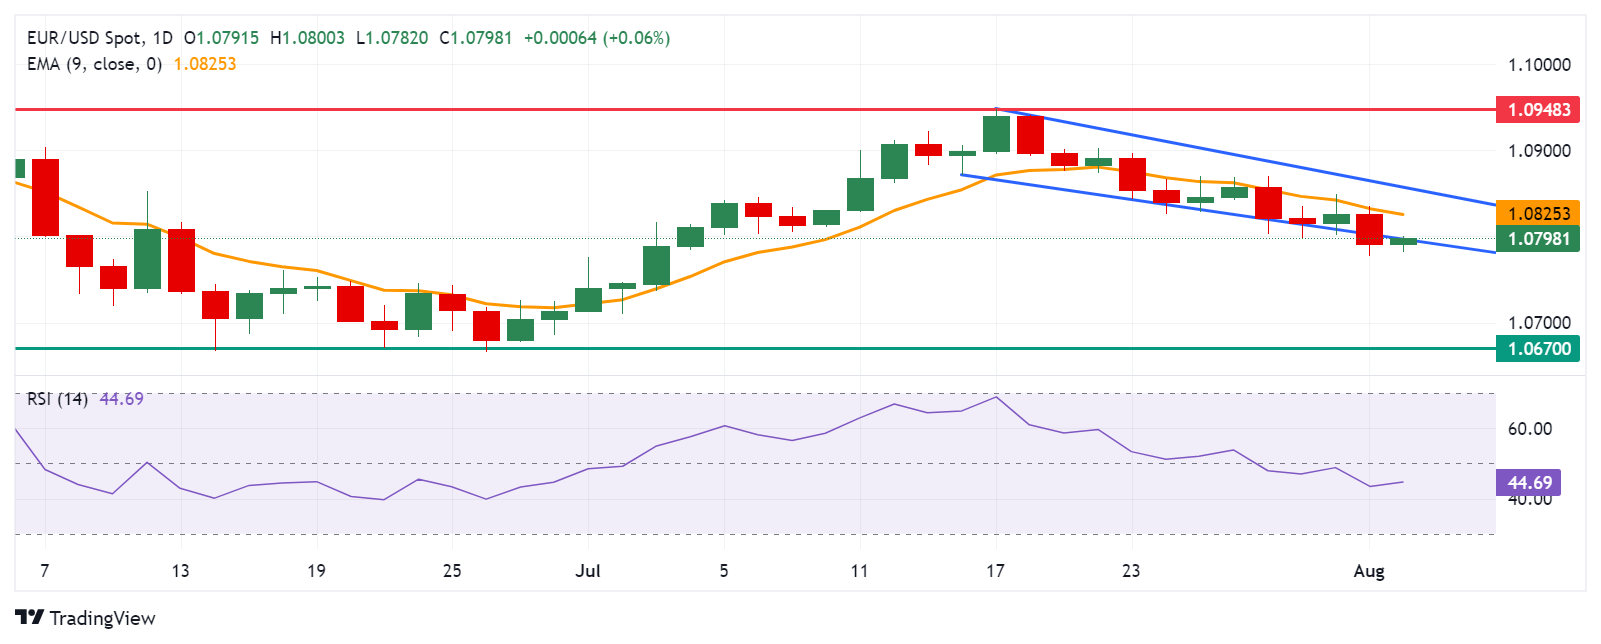
- EUR/USD is testing the lower boundary of the descending channel around the level of 1.0800.
- The 14-day RSI momentum indicator confirms the bearish sentiment for the pair.
- The pair could find key resistance around the nine-day EMA at 1.0825.
EUR/USD is recovering its recent losses from the previous session, trading around 1.0800 during the Asian hours on Friday. The daily chart analysis indicates that the pair is following the lower boundary of a descending channel, suggesting a strengthening of the bearish trend.
Moreover, the 14-day Relative Strength Index (RSI), a momentum indicator, is holding below the 50 level, confirming the bearish sentiment for the EUR/USD pair. If the RSI approaches the 50 level, it could ease the bearish bias and offer some support for the pair.
On the downside, a break below the lower boundary of the descending channel around the 1.0800 level could reinforce the bearish sentiment and put pressure on the EUR/USD pair to navigate the region around the key 1.0670 level, which could serve as a retracement support level.
In terms of resistance, the EUR/GBP pair could face a barrier around the nine-day exponential moving average (EMA) at 1.0825, and additional resistance could lie at the upper boundary of the descending channel around 1.0850. A break above this level could take the pair back to the four-month high of 1.0948.
EUR/USD: Daily Chart
Euro PRICE Today
The table below shows the exchange rate of the Euro (EUR) against major currencies today. The Euro was the strongest currency against the British Pound.
| USD | EUR | GBP | JPY | CAD | AUD | NZD | CHF | |
|---|---|---|---|---|---|---|---|---|
| USD | -0.06% | 0.09% | -0.10% | -0.08% | -0.14% | -0.02% | -0.17% | |
| EUR | 0.06% | 0.15% | -0.05% | -0.03% | -0.07% | 0.04% | -0.10% | |
| GBP | -0.09% | -0.15% | -0.21% | -0.17% | -0.24% | -0.10% | -0.23% | |
| JPY | 0.10% | 0.05% | 0.21% | 0.03% | -0.04% | 0.07% | -0.05% | |
| CAD | 0.08% | 0.03% | 0.17% | -0.03% | -0.06% | 0.08% | -0.07% | |
| AUD | 0.14% | 0.07% | 0.24% | 0.04% | 0.06% | 0.14% | -0.02% | |
| NZD | 0.02% | -0.04% | 0.10% | -0.07% | -0.08% | -0.14% | -0.12% | |
| CHF | 0.17% | 0.10% | 0.23% | 0.05% | 0.07% | 0.02% | 0.12% |
The heatmap shows percentage changes of major currencies. The base currency is selected from the left column, while the quote currency is selected from the top row. For example, if you choose the Euro from the left column and move along the horizontal line to the US Dollar, the percentage change shown in the chart will represent the EUR (base)/USD (quote).
Source: Fx Street
I am Joshua Winder, a senior-level journalist and editor at World Stock Market. I specialize in covering news related to the stock market and economic trends. With more than 8 years of experience in this field, I have become an expert in financial reporting.


