
- EUR/USD adds to weekly leg down around 1.0500.
- Additional losses seem likely in the short term horizon.
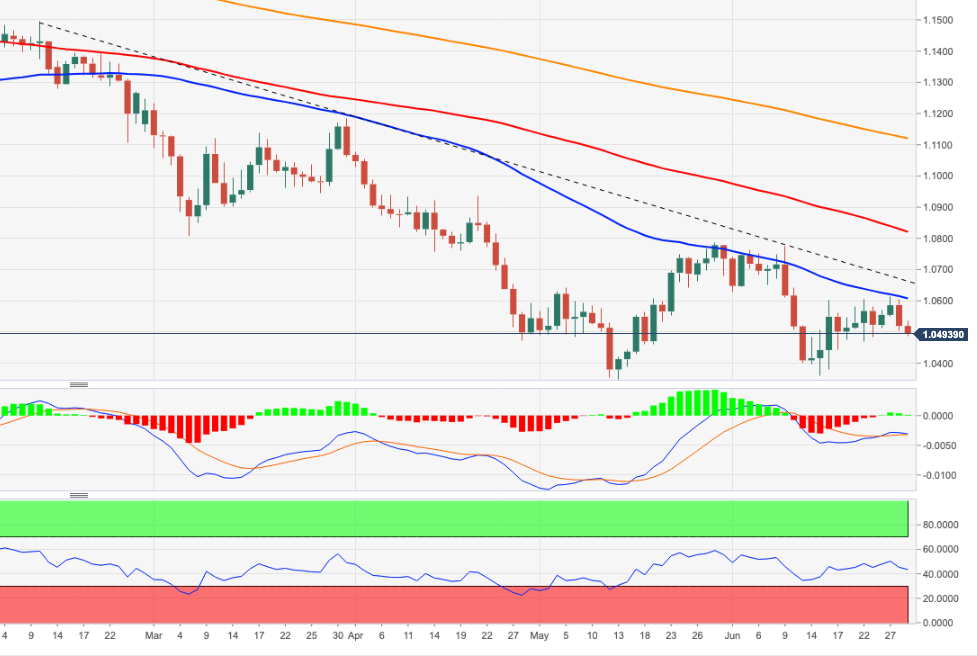
The EUR/USD adds to recent weakness and revisits the 1.0480 area on Wednesday, where initial support appeared.
The inability to break out of the 4-month line near 1.0650 should keep the bearish pressure around the pair. Conversely, further losses are expected to follow, although a revisit to June’s low at 1.0358 seems out of the question for now.
In the long term, the bearish view on the pair is expected to prevail as long as it trades below the 200-day SMA at 1.1119.
EUR/USD daily chart
Technical levels
Source: Fx Street
With 6 years of experience, I bring to the table captivating and informative writing in the world news category. My expertise covers a range of industries, including tourism, technology, forex and stocks. From brief social media posts to in-depth articles, I am dedicated to creating compelling content for various platforms.


