
- EUR/USD remains in positive territory near 1.0895 in the European session on Friday.
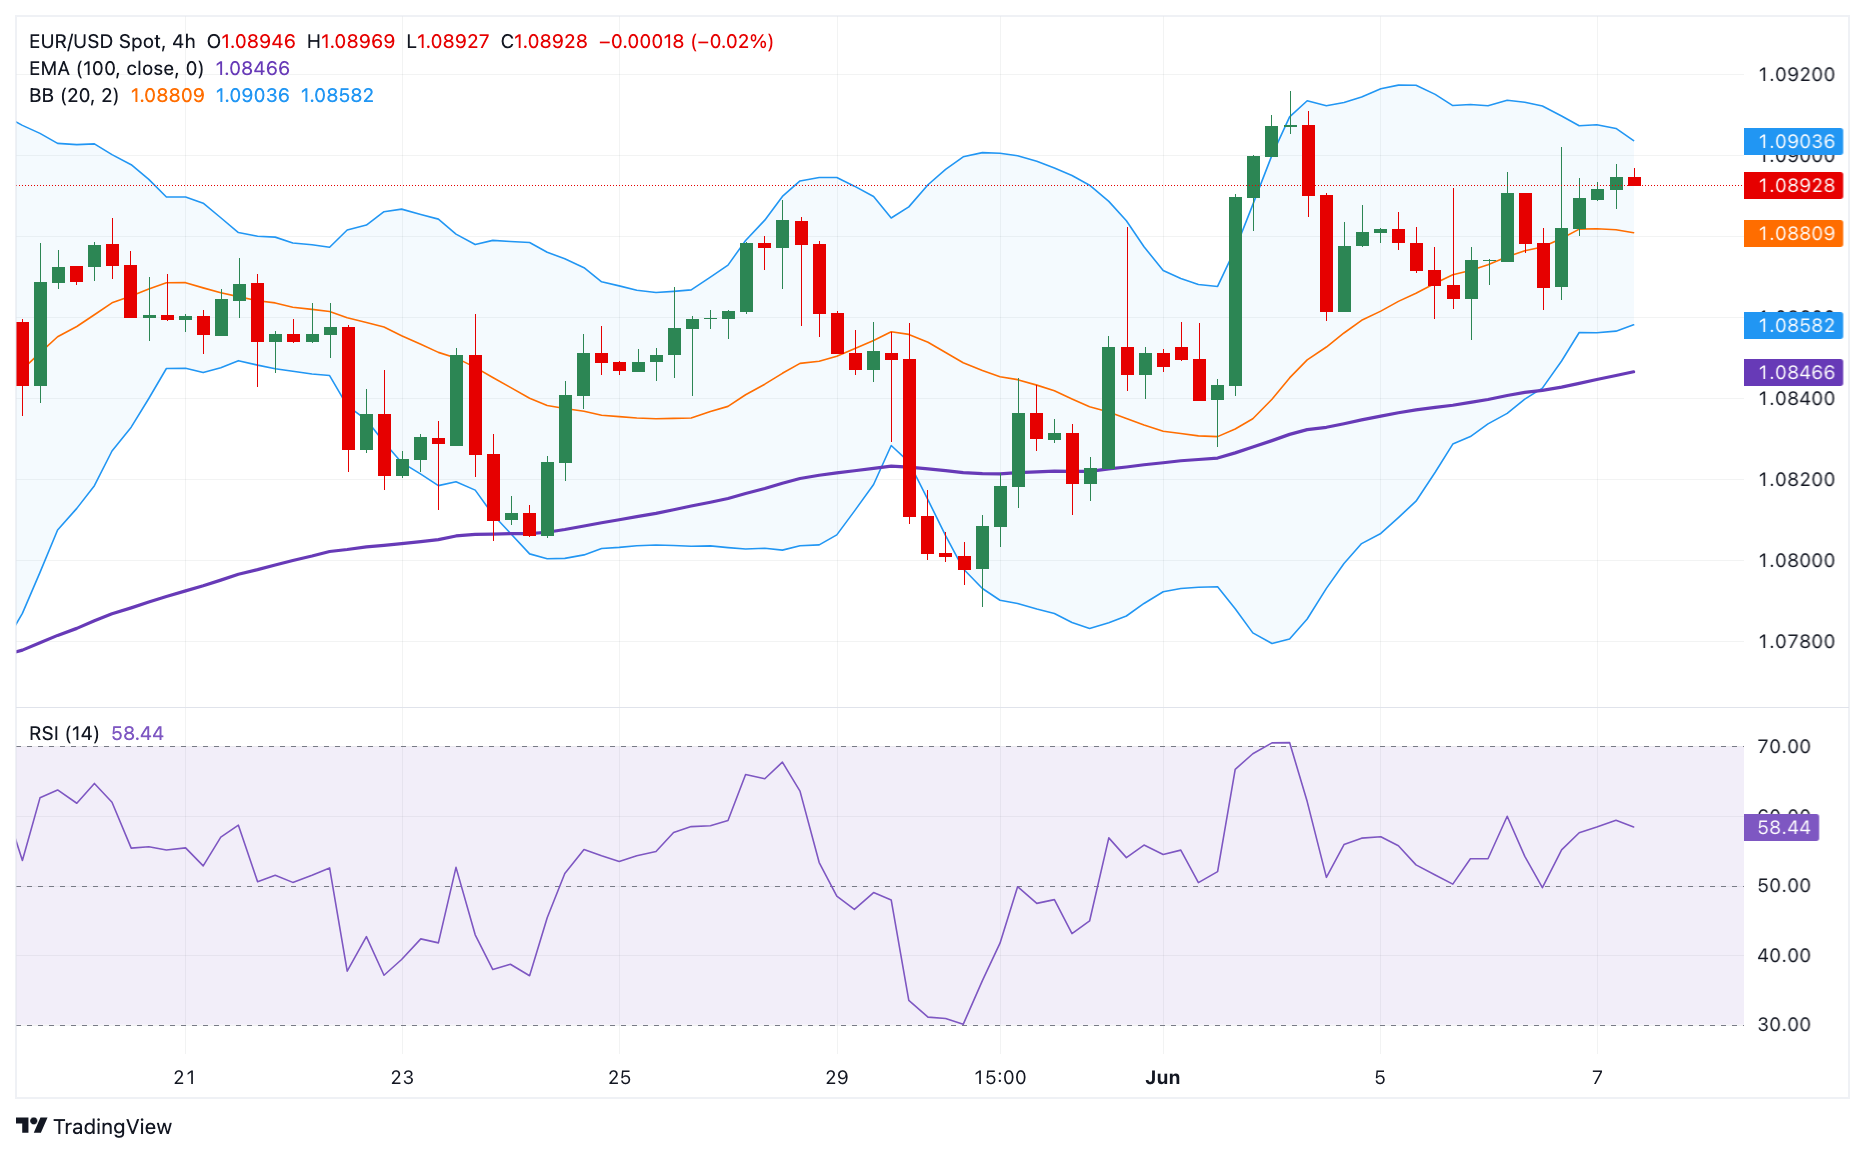
- The pair maintains a positive stance on the 4-hour chart above the 100 EMA, with a bullish RSI indicator.
- The first resistance level is observed in the 1.0900-1.0905 zone; the initial support level is near 1.0860.
EUR/USD trades in positive territory for the second day in a row around 1.0895 during the European session on Friday. The European Central Bank (ECB) decided to cut interest rates by 25 basis points (bps) at its June meeting on Thursday, as widely anticipated by markets. However, traders were not expecting a rate cut in July, and the Euro-USD rate differential is unlikely to widen as much as initial expectations. This, in turn, provides some support to the Euro against the Dollar.
From the technical perspective, EUR/USD maintains the bullish vibe unchanged on the 4-hour chart as the pair remains above the key 100 EMA. Furthermore, the bullish momentum is supported by the Relative Strength Index (RSI), which is in the bullish zone near 60, suggesting that the path of least resistance is to the upside.
The first upside barrier will emerge in the 1.0900-1.0905 region, representing the upper boundary of the Bollinger Band and the psychological level. Further north, the next hurdle is seen near 1.0940, a March 21 high. The additional upside filter to watch is 1.0964 (March 13 high), followed by 1.0981 (March 8 high).
On the other hand, the initial support level for the pair lies around 1.0860, representing the confluence of a June 6 low and the lower boundary of the Bollinger Band. The next contention level to watch is the 100 EMA at 1.0846. Any additional selling below this level will attract some sellers towards 1.0811, a May 31 low.
EUR/USD 4-hour chart
Source: Fx Street
I am Joshua Winder, a senior-level journalist and editor at World Stock Market. I specialize in covering news related to the stock market and economic trends. With more than 8 years of experience in this field, I have become an expert in financial reporting.


