
- EUR/USD moves further north and flirts with 1.0700.
- Further up the 55-day moving average now appears at 1.0788.
EUR/USD rises to fresh May highs just ahead of 1.0700 on Monday.
Considering the current price action of the pair, a continuation of the bounce is likely to happen in the very short term. That said, the next upside barrier now looks like the 55-day Simple Moving Average (SMA) today at 1.0788 before the three-month resistance line around 1.0860.
Breakout of this area should relieve selling pressure and allow a likely move to 1.0936 (21st Apr high).
EUR/USD day chart
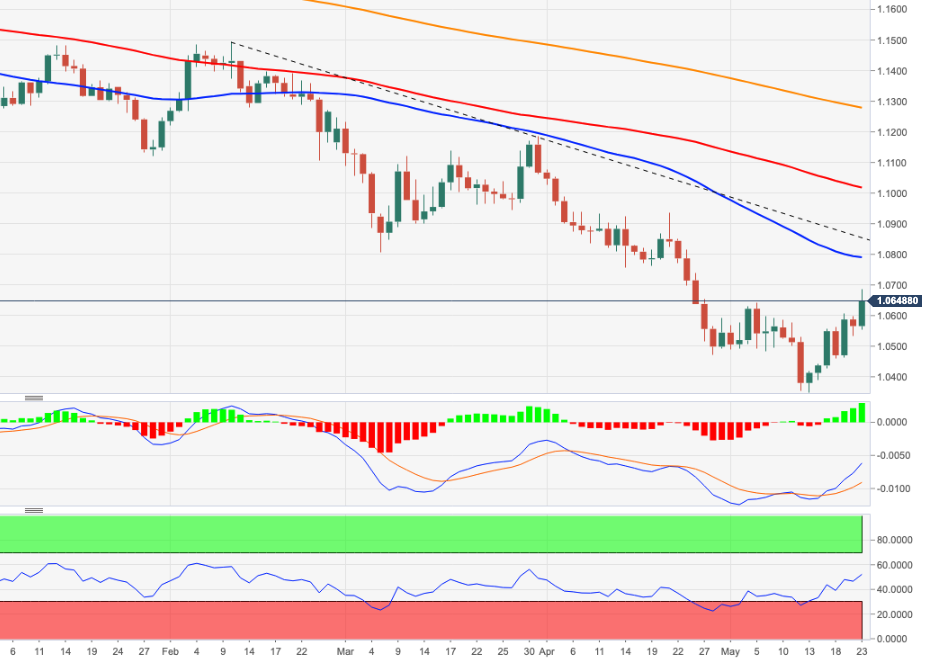
Source: Fx Street
With 6 years of experience, I bring to the table captivating and informative writing in the world news category. My expertise covers a range of industries, including tourism, technology, forex and stocks. From brief social media posts to in-depth articles, I am dedicated to creating compelling content for various platforms.


")

