
- EUR/USD will end the week almost sideways, gaining 0.05%.
- The daily chart of the shared currency is neutral to the downside, but the hourly chart is neutral to the upside.
- EUR/USD Price Analysis: Daily Close Above 1.0200 Could Pave Way To 1.0300; otherwise it could fall towards 1.0096.
The EUR/USD is quoting at 1.0220, after reaching a daily high of 1.0254, but later fell to a daily low of 1.0145 on high US inflation data. In June, personal consumption spending (PCE) increased by 6.8% year-on-year, which fueled expectations of further rate hikes by the Federal Reserve, despite the fact that the market only expected an 80 basis point adjustment.
EUR/USD Price Analysis: Technical Outlook
From a daily chart point of view, the EUR/USD continues to have a neutral bias to the downside, helped by the 20-day EMA below the exchange rate at 1.0167. However, EUR/USD, unable to capitalize on an upbeat market mood, and broad US dollar weakness, keep the shared currency exposed to further selling pressure. If EUR/USD buyers want to change the bias to neutral, they need to reclaim the May 13 low turned resistance at 1.0348. Once broken, the challenge of the 50 day EMA at 1.0423 is up for grabs. On the other hand, if EUR/USD sellers get a daily close below 1.0200, this would pave the way for 1.0096.
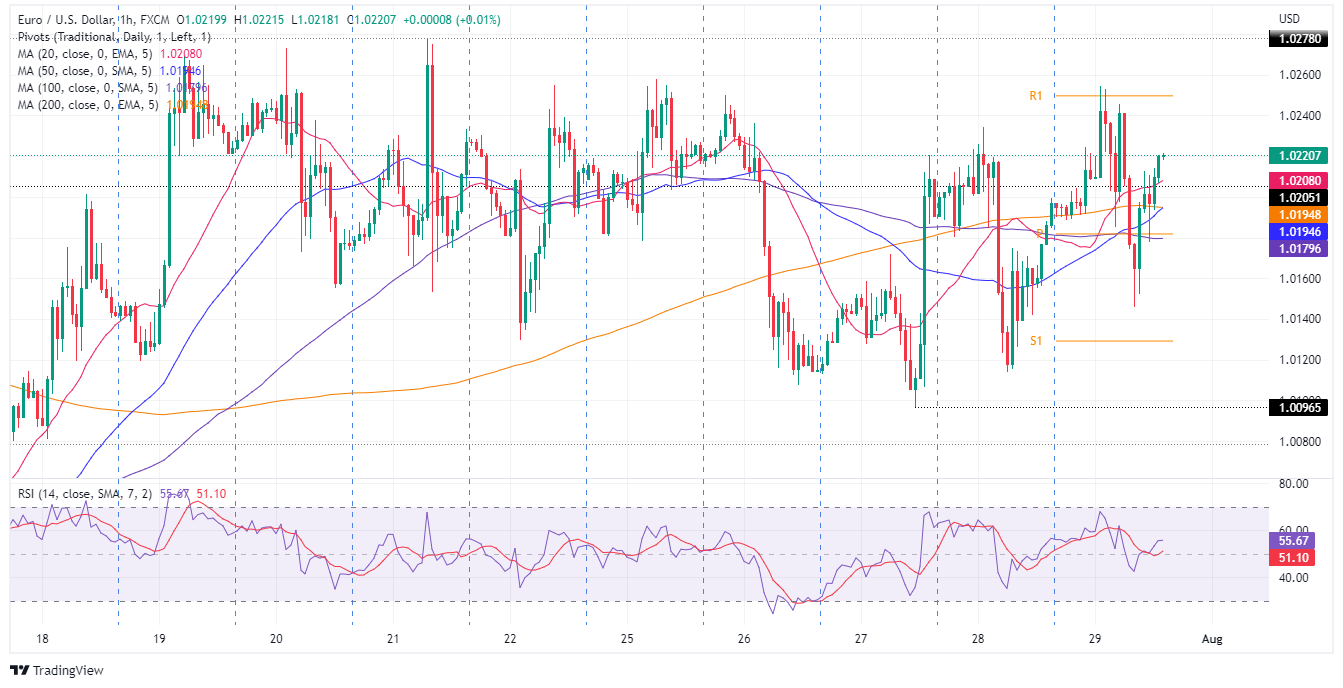
EUR/USD 1 hour chart
In the short term, the EUR/USD hourly chart shows a sideways picture in most cases. Since July 19, the EUR/USD has been trading in the range of 1.0096-1.0278, unable to break either side of the trading range, but EUR/USD traders should note the hourly EMAs below the price , indicating that buying pressure could be building.
Therefore, the first resistance of the EUR/USD would be the daily pivot R1 at 1.0250. Once broken, the next resistance would be 1.0278, followed by 1.-0300. On the other hand, the first support for the EUR/USD would be the 20-hour EMA at 1.0206. If it breaks below, the confluence of the 200 and 50 hourly EMAs will be seen around 1.0192-94, followed by the 100 hourly EMA at 1.0179.
Technical levels
Source: Fx Street
With 6 years of experience, I bring to the table captivating and informative writing in the world news category. My expertise covers a range of industries, including tourism, technology, forex and stocks. From brief social media posts to in-depth articles, I am dedicated to creating compelling content for various platforms.


")

