
- EUR/USD extends two-day bounce to 1.0900 limits.
- If it continues to rise, it could revisit the 2023 high at 1.0929.
EUR/USD rebounds and approaches the 1.0900 area again on Wednesday ahead of US economic data and the Federal Reserve decision.
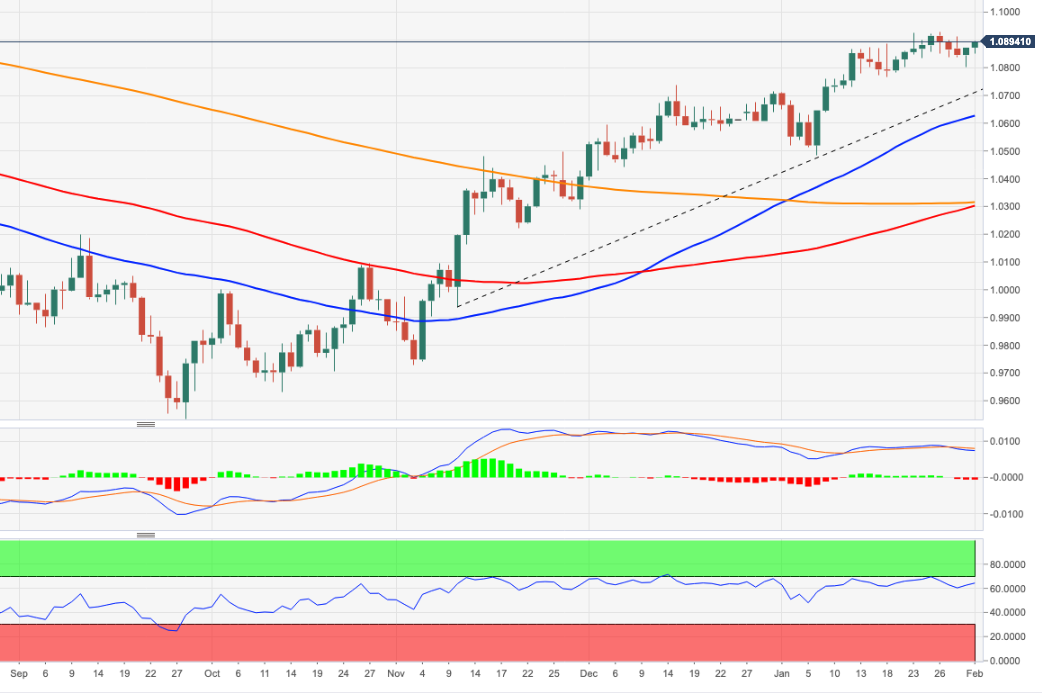
The continuation of the uptrend now needs to clear the 2023 high at 1.0929 (Jan 26) to allow for a test of the weekly high at 1.0936 (21 Apr 2022). A sustainable break above this level could pave the way for a challenge of the key 1.1000 barrier.
Longer-term, the constructive view remains as long as it remains above the 200 SMA at 1.0313 today.
EUR/USD day chart
Source: Fx Street
I am Joshua Winder, a senior-level journalist and editor at World Stock Market. I specialize in covering news related to the stock market and economic trends. With more than 8 years of experience in this field, I have become an expert in financial reporting.


