
- EUR/USD’s strong rally meets resistance around parity.
- Sustainable hikes look likely as gains remain above parity.
So far, EUR/USD has hit a pretty solid hurdle near parity on Wednesday.
Considering the recent strong rebound, further rallies seem likely once the pair leaves parity behind on a sustainable basis. Further up is the intermediate hurdle at the 55 day simple moving average today at 1.0030.
In the longer term, the bearish view on the pair should remain unchanged as long as it is below the 200 SMA at 1.0632.
EUR/USD day chart
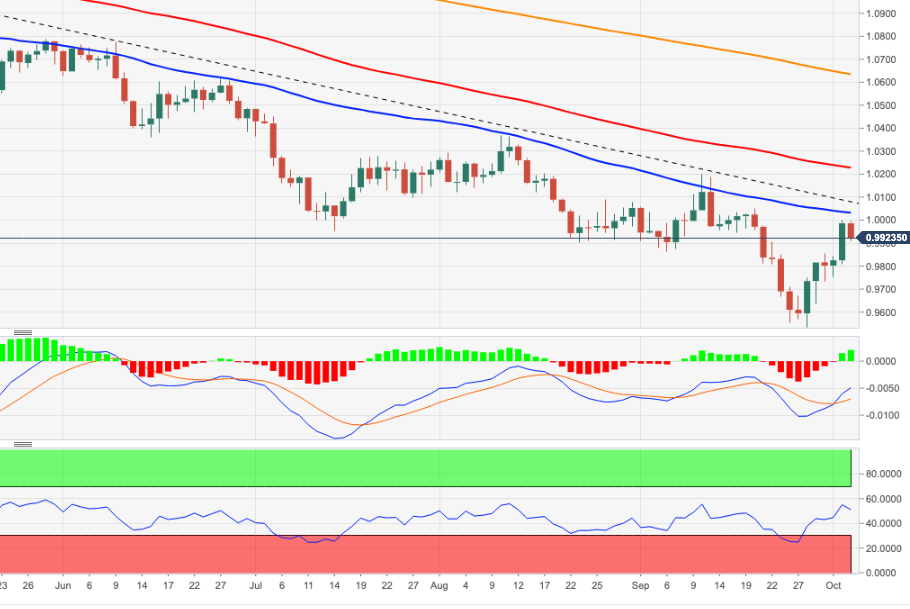
Source: Fx Street
With 6 years of experience, I bring to the table captivating and informative writing in the world news category. My expertise covers a range of industries, including tourism, technology, forex and stocks. From brief social media posts to in-depth articles, I am dedicated to creating compelling content for various platforms.


