
- EUR/USD regains its smile and reverses Wednesday’s decline.
- A further recovery could see the monthly high around 1.0640 revisited.
The EUR/USD pair maintains weekly instability and now recovers the 1.0570 area after Wednesday’s daily decline.
Should the recovery pick up a more serious pace, then the pair is expected to challenge the October high at 1.0639 (Oct 12) before a likely move towards the transient 55-day SMA at 1.0721.
Meanwhile, losses will continue as long as the pair moves below the 200-day SMA at 1.0819.
EUR/USD Daily Chart
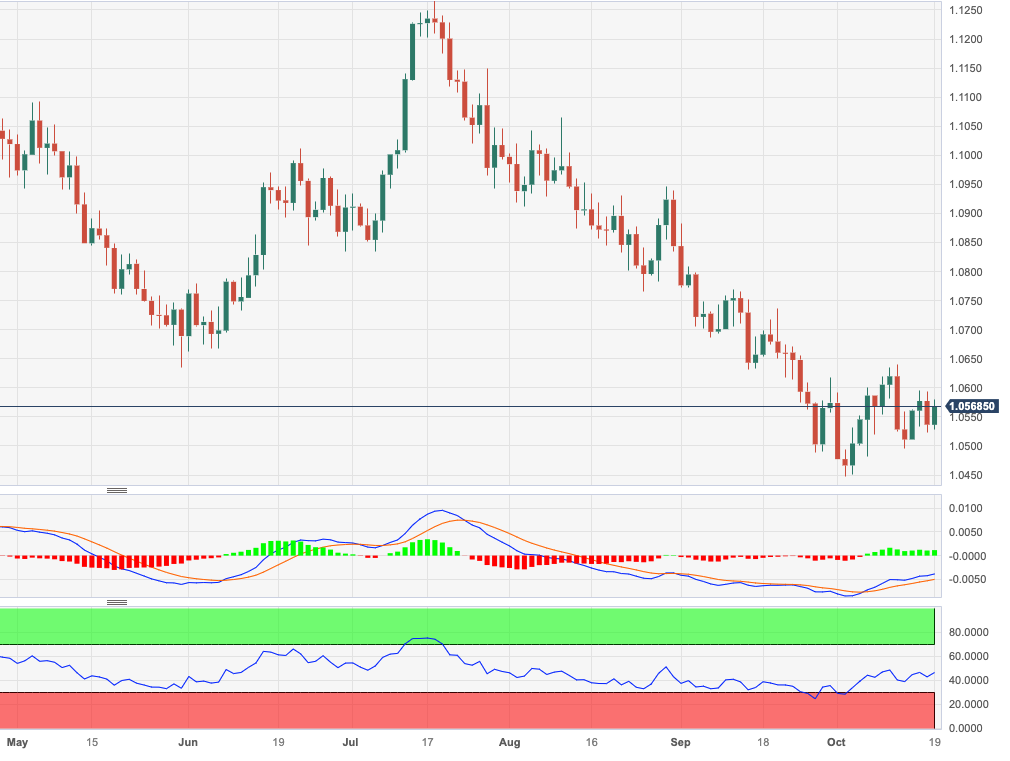
Source: Fx Street
I am Joshua Winder, a senior-level journalist and editor at World Stock Market. I specialize in covering news related to the stock market and economic trends. With more than 8 years of experience in this field, I have become an expert in financial reporting.


