
- The EUR/USD manages to bounce and overcome the 1,900 barrier.
- A drop below 1.0844 exposes further short-term pullback.
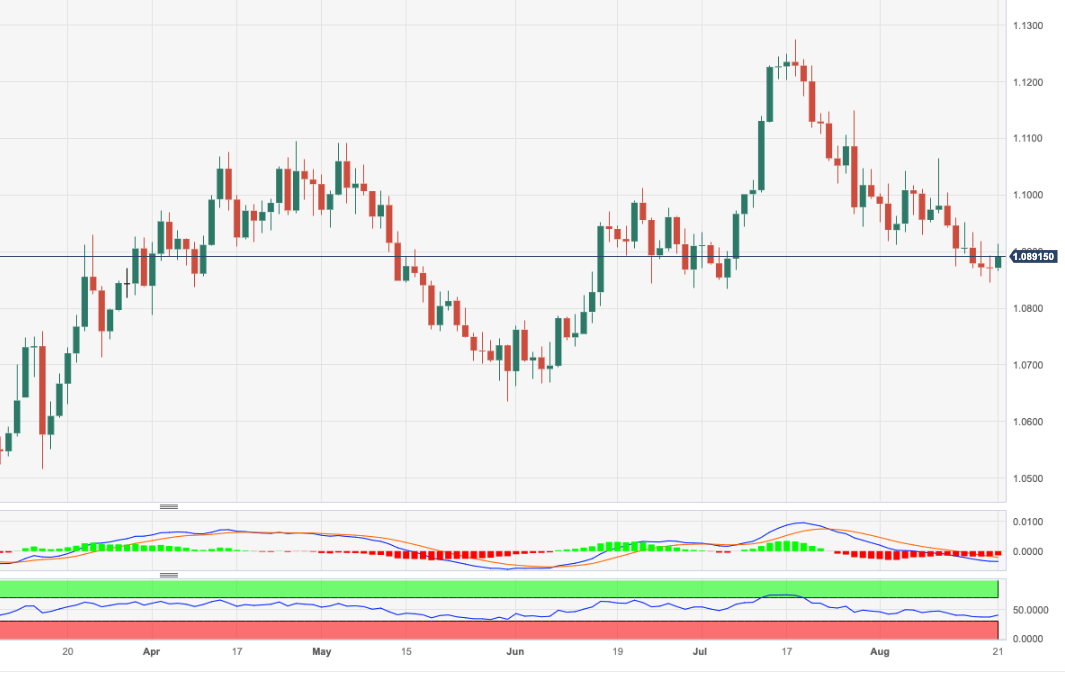
The EUR/USD pair reverses six consecutive daily retracements and recovers above the 1.0900 barrier on Monday.
If the pair resumes the slide, it is expected to revisit the August low of 1.0844 (August 18) before the July low of 1.0833 (July 6). The loss of this region leaves the pair vulnerable to a probable test of the critical 200-day SMA at 1.0792 on the near-term horizon.
Meanwhile, the positive outlook for the pair remains as long as it stays above the 200-day SMA.
EUR/USD daily chart
Source: Fx Street
I am Joshua Winder, a senior-level journalist and editor at World Stock Market. I specialize in covering news related to the stock market and economic trends. With more than 8 years of experience in this field, I have become an expert in financial reporting.


