
- EUR/USD is meeting some sellers at the 1.0560 area.
- Further recovery should target the monthly high at 1.0641.
The EUR/USD trims part of the recent advance after reaching fresh weekly highs in the 1.0560/65 area on Wednesday.
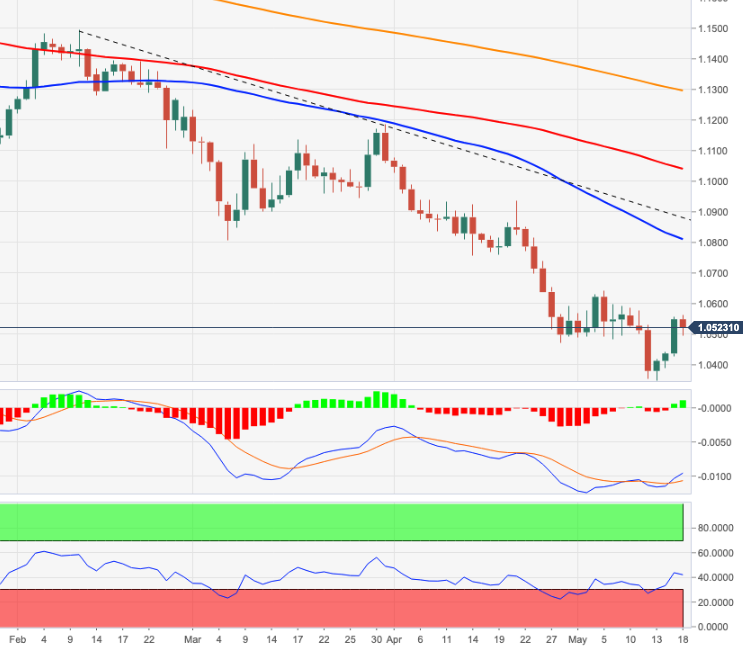
Considering the ongoing price action, a continuation of the bounce looks likely at least in the short term. Against this, the next hurdle comes at the May high at 1.0641 (May 5) before the 55-day SMA today at 1.0809.
Below the 3-month line near 1.0880, the pair is expected to remain under pressure and vulnerable to further losses.
EUR/USD daily chart
Technical levels
Source: Fx Street
With 6 years of experience, I bring to the table captivating and informative writing in the world news category. My expertise covers a range of industries, including tourism, technology, forex and stocks. From brief social media posts to in-depth articles, I am dedicated to creating compelling content for various platforms.


