
- EUR/USD is once again flirting with the key parity level.
- Below parity is the December 2002 low at 0.9859.
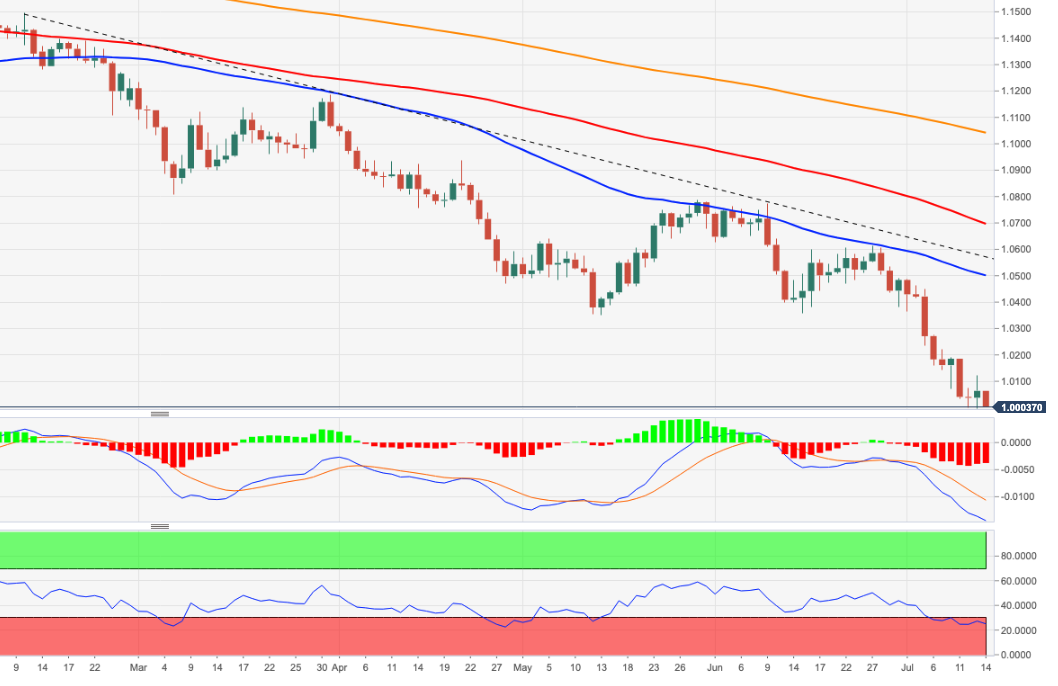
The EUR/USD quickly tempered Wednesday’s bullish attempt towards the 1.0120 area and is refocusing on the downside, especially in the parity zone.
The pair’s bearish stance remains anything but downbeat at the moment. Conversely, a convincing breakout of the parity level should open the door for massive stop-loss orders to be triggered, while the next major support level is expected to appear at the December 2002 low at 0.9859.
As long as the pair navigates below the 5-month support line near 1.0550, more losses are expected.
In the long term, the bearish view on the pair is expected to prevail as long as it trades below the 200-day SMA at 1.1040.
EUR/USD daily chart
Technical levels
Source: Fx Street
With 6 years of experience, I bring to the table captivating and informative writing in the world news category. My expertise covers a range of industries, including tourism, technology, forex and stocks. From brief social media posts to in-depth articles, I am dedicated to creating compelling content for various platforms.


